IBM 1999 Annual Report Download - page 68
Download and view the complete annual report
Please find page 68 of the 1999 IBM annual report below. You can navigate through the pages in the report by either clicking on the pages listed below, or by using the keyword search tool below to find specific information within the annual report.-
 1
1 -
2
-
3
-
4
-
5
-
6
-
7
-
8
-
9
-
10
-
11
-
12
-
13
-
14
-
15
-
16
-
17
-
18
-
19
-
20
-
21
-
22
-
23
-
24
-
25
-
26
-
27
-
28
-
29
-
30
-
31
-
32
-
33
-
34
-
35
-
36
-
37
-
38
-
39
-
40
-
41
-
42
-
43
-
44
-
45
-
46
-
47
-
48
-
49
-
50
-
51
-
52
-
53
-
54
-
55
-
56
-
57
-
 58
58 -
 59
59 -
 60
60 -
 61
61 -
 62
62 -
 63
63 -
 64
64 -
 65
65 -
 66
66 -
 67
67 -
 68
68 -
 69
69 -
 70
70 -
 71
71 -
 72
72 -
 73
73 -
 74
74 -
 75
75 -
 76
76 -
 77
77 -
 78
78 -
79
-
80
-
81
-
82
-
83
-
84
-
85
-
86
-
87
-
88
-
89
-
90
-
91
-
92
-
93
-
94
-
95
-
96
-
97
-
98
-
99
-
100
 |
 |

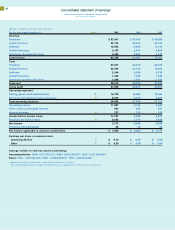
consolidated statement of stockholders’ equity
International Business Machines Corporation
and Subsidiary Companies
Accumulated
Gains and
Losses Not
Employee Affecting
Preferred Common Retained Treasury Benefits Retained
(Dollars in millions) Stock Stock Earnings Stock Trust Earnings Total
1997 *
Stockholders’ equity, January 1, 1997 $«253 $«««7,752 $«11,189 $«(135) $÷÷«÷— $«2,569 $«21,628
Net income plus gains and losses not
affecting retained earnings:
Net income 6,093 $«««6,093
Gains and losses not affecting
retained earnings (net of tax):
Foreign currency translation adjustments
(net of tax expense of $24) (1,610) (1,610)
Net unrealized losses on marketable
securities (net of tax benefit of $37) (60) (60)
Total gains and losses not affecting
retained earnings (1,670)
Subtotal: Net income plus gains and
losses not affecting retained earnings $«««4,423
Cash dividends declared—common stock (763) (763)
Cash dividends declared—preferred stock (20) (20)
Common stock purchased and retired
(137,554,672** shares) (565) (5,455) (6,020)
Preferred stock purchased and
retired (13,450 shares) (1) (1)
Common stock issued under employee
plans (39,303,206** shares) 985 (2) 983
Purchases (8,254,336** shares) and sales
(10,764,558** shares) of treasury stock
under employee plans—net (32) 49 17
Employee benefits trust (20,000,000** shares) (860) (860)
Tax effect—stock transactions 429 429
Stockholders’ equity, December 31, 1997 «$«252 $«««8,601 «$«11,010 ««$«««(86) «$««««(860) ««$««««899 «$«19,816
1998*
Net income plus gains and losses not
affecting retained earnings:
Net income 6,328 $«««6,328
Gains and losses not affecting
retained earnings (net of tax):
Foreign currency translation adjustments
(net of tax benefit of $45) 69 69
Net unrealized losses on marketable
securities (net of tax benefit of $36) (57) (57)
Total gains and losses not affecting
retained earnings 12
Subtotal: Net income plus gains and
losses not affecting retained earnings $«««6,340
Cash dividends declared—common stock (814) (814)
Cash dividends declared—preferred stock (20) (20)
Common stock purchased and retired
(113,993,636** shares) (556) (6,291) (6,847)
Preferred stock purchased and retired
(51,250 shares) (5) (5)
Common stock issued under employee
plans (29,701,038** shares) 709 (1) 708
Purchases (9,100,678** shares) and sales
(9,024,296** shares) of treasury stock
under employee plans—net (71) (47) (118)
Fair value adjustment of employee benefits trust 1,002 (994) 8
Tax effect—stock transactions 365 365
Stockholders’ equity, December 31, 1998 $«247 $«10,121 $«10,141 $«(133) $«(1,854) $««««911 $«19,433
66