IBM 1999 Annual Report Download - page 82
Download and view the complete annual report
Please find page 82 of the 1999 IBM annual report below. You can navigate through the pages in the report by either clicking on the pages listed below, or by using the keyword search tool below to find specific information within the annual report.-
 1
1 -
2
-
3
-
4
-
5
-
6
-
7
-
8
-
9
-
10
-
11
-
12
-
13
-
14
-
15
-
16
-
17
-
18
-
19
-
20
-
21
-
22
-
23
-
24
-
25
-
26
-
27
-
28
-
29
-
30
-
31
-
32
-
33
-
34
-
35
-
36
-
37
-
38
-
39
-
40
-
41
-
42
-
43
-
44
-
45
-
46
-
47
-
48
-
49
-
50
-
51
-
52
-
53
-
54
-
55
-
56
-
57
-
58
-
59
-
60
-
61
-
62
-
63
-
64
-
65
-
66
-
67
-
68
-
69
-
70
-
71
-
 72
72 -
 73
73 -
 74
74 -
 75
75 -
 76
76 -
 77
77 -
 78
78 -
 79
79 -
 80
80 -
 81
81 -
 82
82 -
 83
83 -
 84
84 -
 85
85 -
 86
86 -
 87
87 -
 88
88 -
 89
89 -
 90
90 -
 91
91 -
 92
92 -
93
-
94
-
95
-
96
-
97
-
98
-
99
-
100
 |
 |

notes to consolidated financial statements
International Business Machines Corporation
and Subsidiary Companies
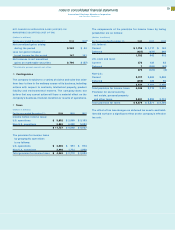
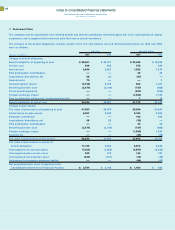
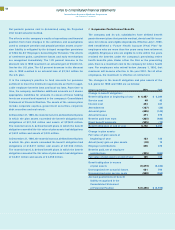
The significant components of activities that gave rise to
deferred tax assets and liabilities that are recorded on the
balance sheet were as follows:
DEFERRED TAX ASSETS
(Dollars in millions)
At December 31: 1999 1998
Employee benefits $«««3,737 $«««3,909
Alternative minimum tax credits 1,244 1,169
Bad debt, inventory and
warranty reserves 1,093 1,249
Infrastructure reduction charges 918 863
Capitalized research and development 880 913
Deferred income 870 686
General business credits 605 555
Foreign tax loss carryforwards 406 304
Equity alliances 377 387
Depreciation 326 201
State and local tax loss carryforwards 227 212
Intracompany sales and services 153 182
Other 2,763 2,614
Gross deferred tax assets 13,599 13,244
Less: Valuation allowance 647 488
Net deferred tax assets $«12,952 $«12,756
DEFERRED TAX LIABILITIES
(Dollars in millions)
At December 31: 1999 1998
Retirement benefits $«««3,092 $«««2,775
Sales-type leases 2,914 3,433
Depreciation 1,237 1,505
Software costs deferred 250 287
Other 2,058 1,841
Gross deferred tax liabilities $«««9,551 $«««9,841
The valuation allowance at December 31, 1999, principally applies
to certain state and local and foreign tax loss carryforwards
that, in the opinion of management, are more likely than not to
expire before the company can use them.
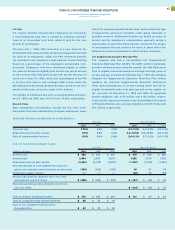
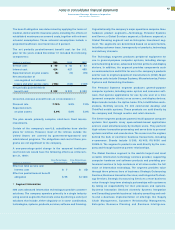
A reconciliation of the company’s effective tax rate to the statutory
U.S. federal tax rate is as follows:
For the year ended December 31: 1999 1998 1997
Statutory rate 35% 35% 35%
Foreign tax differential (2) (6) (3)
State and local 111
Valuation allowance
related items —(1) —
Other —1—
Effective rate 34% 30% 33%
For tax return purposes, the company has available tax credit
carryforwards of approximately $1,919 million, of which $1,244 mil-
lion have an indefinite carryforward period, $199 million expire
in 2004 and the remainder thereafter. The company also has
state and local and foreign tax loss carryforwards, the tax effect
of which is $633 million. Most of these carryforwards are avail-
able for 10 years or have an indefinite carryforward period.
Undistributed earnings of non-U.S. subsidiaries included in
consolidated retained earnings were $14,900 million at
December 31, 1999, $13,165 million at December 31, 1998, and
$12,511 million at December 31, 1997. These earnings, which
reflect full provision for non-U.S. income taxes, are indefinitely
reinvested in non-U.S. operations or will be remitted substan-
tially free of additional tax.
Q Selling and Advertising
Selling and advertising expense is charged against income as
incurred. Advertising expense, which includes media, agency
and promotional expenses, was $1,758 million, $1,681 million
and $1,708 million in 1999, 1998 and 1997, respectively.
80