IBM 1999 Annual Report Download - page 55
Download and view the complete annual report
Please find page 55 of the 1999 IBM annual report below. You can navigate through the pages in the report by either clicking on the pages listed below, or by using the keyword search tool below to find specific information within the annual report.-
 1
1 -
2
-
3
-
4
-
5
-
6
-
7
-
8
-
9
-
10
-
11
-
12
-
13
-
14
-
15
-
16
-
17
-
18
-
19
-
20
-
21
-
22
-
23
-
24
-
25
-
26
-
27
-
28
-
29
-
30
-
31
-
32
-
33
-
34
-
35
-
36
-
37
-
38
-
39
-
40
-
41
-
42
-
43
-
44
-
 45
45 -
 46
46 -
 47
47 -
 48
48 -
 49
49 -
 50
50 -
 51
51 -
 52
52 -
 53
53 -
 54
54 -
 55
55 -
 56
56 -
 57
57 -
 58
58 -
 59
59 -
 60
60 -
 61
61 -
 62
62 -
 63
63 -
 64
64 -
 65
65 -
66
-
67
-
68
-
69
-
70
-
71
-
72
-
73
-
74
-
75
-
76
-
77
-
78
-
79
-
80
-
81
-
82
-
83
-
84
-
85
-
86
-
87
-
88
-
89
-
90
-
91
-
92
-
93
-
94
-
95
-
96
-
97
-
98
-
99
-
100
 |
 |

management discussion
International Business Machines Corporation
and Subsidiary Companies
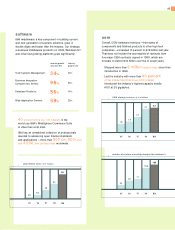
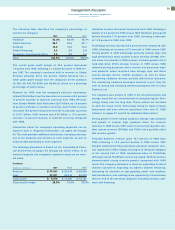
The following table identifies the company’s percentage of
revenue by category:
1999 1998 1997
Hardware 42.3% 43.4% 46.7%
Global Services 36.7 35.4 32.1
Software 14.5 14.5 14.2
Global Financing 3.6 3.5 3.6
Enterprise Investments/ Other 2.9 3.2 3.4
Total 100.0% 100.0% 100.0%
The overall gross profit margin of 36.4 percent decreased
1.4 points from 1998, following a 1.2 point decrease in 1998 ver-
sus 1997. The company’s continued shift in revenue to Global
Services primarily drove the decline. Global Services has a
lower gross profit margin than the company’s server products
(S/ 390, AS/ 400, RS/ 6000 and NUMA-Q), which are a declining
percentage of total revenue.
Revenue for 1999 from the company’s end-user businesses
totaled $38.8 billion from the Americas, an increase of 5.2 percent
(7 percent increase in constant currency) from 1998. Revenue
from Europe/ Middle East/ Africa was $25.7 billion, up 1.8 percent
(6 percent increase in constant currency). Asia Pacific revenue
increased 19.4 percent (8 percent increase in constant currency)
to $15.2 billion. OEM revenue was $7.8 billion, a 15.3 percent
increase (14 percent increase in constant currency) compared
with 1998.
Information about the company’s operating segments can be
found in note Y, “Segment Information,” on pages 89 through
93. This note provides additional information, including a descrip-
tion of the products and services of each segment, as well as
financial data pertaining to each segment.
The following discussion is based on the Consolidated Finan-
cial Statements on pages 64 through 68, which reflect, in all
material respects, the company’s segment results on an exter-
nal basis.
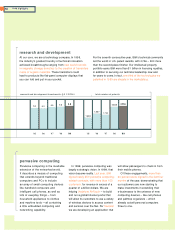
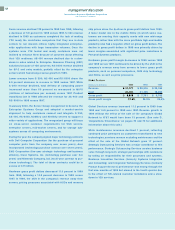
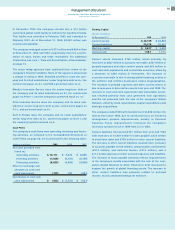
Hardware
(Dollars in millions) 1999 1998 1997
Revenue $«37,041 $«35,419 $«36,630
Cost 27,071 24,214 23,473
Gross profit $«««9,970 $«11,205 $«13,157
Gross profit margin 26.9% 31.6% 35.9%
Hardware revenue increased 4.6 percent from 1998, following a
decline of 3.3 percent in 1998 versus 1997. Hardware gross profit
dollars declined 11.0 percent from 1998, following a decrease
of 14.8 percent in 1998 from 1997.
Technology revenue increased 5.9 percent when compared with
1998, following an increase of 7.3 percent in 1998 versus 1997.
Strong growth in OEM technology, primarily custom logic and
high-performance static random access memory (SRAM) reve-
nue drove the increase in 1999 revenue. A slower growth rate in
hard disk drive (HDD) storage revenue in 1999 versus 1998
reflected pricing pressures and a revenue mix away from high-
end products. Lower revenues from storage tape and direct
access storage device (DASD) products, as well as lower
networking hardware revenue, partially offset those increases.
The networking hardware decreases resulted, in part, from the
sale of routing and switching intellectual property (IP) to Cisco
Systems, Inc.
The company took actions in 1999 in the microelectronics and
storage areas that are aimed directly at strengthening the Tech-
nology Group over the long term. Those actions are intended
to shift the focus of the Technology Group to higher margin
businesses and more efficient operations. (See note R, “1999
Actions,” on pages 81 and 82 for additional information.)
Strong growth in HDD storage products, storage tape products
and growth in custom logic products drove the revenue
increase in 1998 versus 1997. Lower revenue from dynamic ran-
dom access memory (DRAMs) and DASD sales partially offset
this revenue growth.
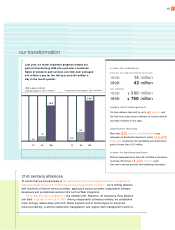
Personal Systems revenue grew
19
.7 percent in
19
99 from
19
98, following a 10.9 percent decline in
19
98 versus
19
97.
Despite continued pricing pressures, personal computer reve-
nue improved in
19
99. Supply shortages of flat-panel displays
in the second half of
19
99 constrained sales of ThinkPads,
although overall ThinkPad revenue was good. Netfinity servers
demonstrated strong revenue growth, compared with
19
98
levels. The company continues to focus on expanding its direct
channel customers; improving its indirect channel efficiency;
increasing its attention on fast-growing, small- and medium-
size businesses; and realizing more opportunity in businesses
that are tied to the personal computer, including services, soft-
ware and financing.
53