IBM 1999 Annual Report Download - page 64
Download and view the complete annual report
Please find page 64 of the 1999 IBM annual report below. You can navigate through the pages in the report by either clicking on the pages listed below, or by using the keyword search tool below to find specific information within the annual report.-
 1
1 -
2
-
3
-
4
-
5
-
6
-
7
-
8
-
9
-
10
-
11
-
12
-
13
-
14
-
15
-
16
-
17
-
18
-
19
-
20
-
21
-
22
-
23
-
24
-
25
-
26
-
27
-
28
-
29
-
30
-
31
-
32
-
33
-
34
-
35
-
36
-
37
-
38
-
39
-
40
-
41
-
42
-
43
-
44
-
45
-
46
-
47
-
48
-
49
-
50
-
51
-
52
-
53
-
 54
54 -
 55
55 -
 56
56 -
 57
57 -
 58
58 -
 59
59 -
 60
60 -
 61
61 -
 62
62 -
 63
63 -
 64
64 -
 65
65 -
 66
66 -
 67
67 -
 68
68 -
 69
69 -
 70
70 -
 71
71 -
 72
72 -
 73
73 -
 74
74 -
75
-
76
-
77
-
78
-
79
-
80
-
81
-
82
-
83
-
84
-
85
-
86
-
87
-
88
-
89
-
90
-
91
-
92
-
93
-
94
-
95
-
96
-
97
-
98
-
99
-
100
 |
 |

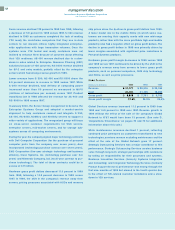
Total Run Out of 1999 Balance
2003 and
(Dollars in millions) 1997 1998 1999 2000 2001 2002 beyond
Sales-type leases $««««563 $««««685 $÷÷737 $«209 $«301 $«198 $«29
Operating leases 701 731 609 319 197 87 6
Total residual value $«1,264 $«1,416 $«1,346 $«528 $«498 $«285 $«35
management discussion
International Business Machines Corporation
and Subsidiary Companies
Foreign Currency Exchange Rate Risk: As of December 31, 1999, a
10 percent decrease or increase in the levels of foreign currency
exchange rates against the U.S. dollar with all other variables
held constant would result in a decrease in the fair value of the
company’s financial instruments of $1,319 million or an increase
in the fair value of the company’s financial instruments of
$1,340 million, respectively, compared with a decrease of
$597 million or an increase of $855 million, respectively, as of
December 31, 1998. The change in the relative sensitivity of the
fair market value of the company’s financial instrument portfolio
to the level of foreign currency exchange rates primarily is driven
by an increase in the overall level of net foreign investment
hedging activity as well as by an increase in the use of foreign
currency forwards in lieu of foreign currency options to hedge
the company’s various foreign currency exposures in accordance
with the company’s established risk management practices.
As the effect of offsetting changes in the fair market value of
the company’s net foreign investments are not included in the
sensitivity model, the results of the analysis do not indicate an
increase in the company’s actual exposure to foreign currency
exchange rate risk.
Financing Risks
Global financing is an integral part of the company’s total world-
wide offerings. Inherent in global financing are certain risks,
including credit, interest rate, currency and residual value. The
company manages credit risk through comprehensive credit
evaluations and pricing practices. To manage the risks associ-
ated with an uncertain interest rate environment, the company
pursues a funding strategy of substantially matching the terms of
its debt with the terms of its assets. Currency risks are managed
by denominating liabilities in the same currency as the assets.
Residual value risk is managed by developing projections of
future equipment values at lease inception, reevaluating these
projections periodically, and effectively deploying remarketing
capabilities to recover residual values and potentially earn a profit.
Remarketing efforts consistently have generated profits. The
following table depicts an approximation of the unguaranteed
residual value maturities for the company’s sales-type leases, as
well as a projection of the remaining net book value of machines
on operating leases at the end of the lease terms as of Dec-
ember 31, 1997, 1998 and 1999. The following table excludes
approximately $34 million of estimated residual value associated
with non-information technology equipment.
62