IBM 1999 Annual Report Download - page 54
Download and view the complete annual report
Please find page 54 of the 1999 IBM annual report below. You can navigate through the pages in the report by either clicking on the pages listed below, or by using the keyword search tool below to find specific information within the annual report.-
 1
1 -
2
-
3
-
4
-
5
-
6
-
7
-
8
-
9
-
10
-
11
-
12
-
13
-
14
-
15
-
16
-
17
-
18
-
19
-
20
-
21
-
22
-
23
-
24
-
25
-
26
-
27
-
28
-
29
-
30
-
31
-
32
-
33
-
34
-
35
-
36
-
37
-
38
-
39
-
40
-
41
-
42
-
43
-
 44
44 -
 45
45 -
 46
46 -
 47
47 -
 48
48 -
 49
49 -
 50
50 -
 51
51 -
 52
52 -
 53
53 -
 54
54 -
 55
55 -
 56
56 -
 57
57 -
 58
58 -
 59
59 -
 60
60 -
 61
61 -
 62
62 -
 63
63 -
 64
64 -
65
-
66
-
67
-
68
-
69
-
70
-
71
-
72
-
73
-
74
-
75
-
76
-
77
-
78
-
79
-
80
-
81
-
82
-
83
-
84
-
85
-
86
-
87
-
88
-
89
-
90
-
91
-
92
-
93
-
94
-
95
-
96
-
97
-
98
-
99
-
100
 |
 |

management discussion
International Business Machines Corporation
and Subsidiary Companies
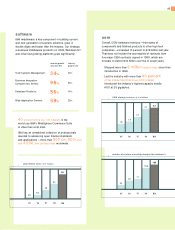
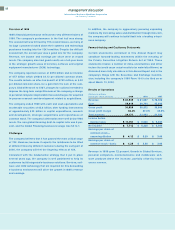
Overview of 1999
IBM’s financial performance reflects two very different halves of
1999. The company’s performance in the first half was strong.
The second half was hit hard by Y2K-related issues, as many of
its large customers locked down their systems and technology
purchases heading into the Y2Ktransition. Despite the difficult
second half, the overall year was a good one for the company.
Revenue, net income and earnings per share were at record
levels. The company also had good results on a full-year basis
in the strategic growth areas of services, software and original
equipment manufacturer (OEM) technology.
The company reported revenue of $87.5 billion and net income
of $7.7 billion which yielded $4.12 per diluted common share.
The results include an after-tax benefit of $750 million, or $.40
per diluted common share, for a gain from the sale of the com-
pany’s Global Network to AT&T, charges for actions intended to
improve the long-term competitiveness of the company, a change
in personal computer depreciable lives and charges for acquired
in-process research and development related to acquisitions.
The company ended 1999 with cash and cash equivalents and
marketable securities of $5.8 billion, after funding investments
of approximately $20 billion in capital expenditures, research
and development, strategic acquisitions and repurchases of
common stock. The company’s debt ratios were well below 1998
levels. The non-global financing debt-to-capital ratio was 9 per-
cent, and the Global Financing business leverage was 5.5 to 1.
Challenges
The company believes that it has passed the most critical stage
of Y2K. However, because it expects the lockdowns to be lifted
at different times by different customers during the early part of
2000, the company will feel the lingering effects of Y2K.
Consistent with the fundamental strategy that it put in place
several years ago, the company is well positioned to help its
customers build integrated e-business solutions. Services, soft-
ware and OEM technology that are required for this demanding
e-business environment will drive the growth in IBM’s revenue
and earnings.
In addition, the company is aggressively pursuing expanding
markets. By increasing sales and distribution through ibm.com,
the company will continue to build itself into a leading e-busi-
ness company.
Forward-looking and Cautionary Statements
Certain statements contained in this Annual Report may
constitute forward-looking statements within the meaning of
the Private Securities Litigation Reform Act of 1995. These
statements involve a number of risks, uncertainties and other
factors
that could cause actual results to be materially different, as
dis
cussed more fully elsewhere in this Annual Report and in the
company’s filings with the Securities and Exchange Commis-
sion, including the company’s 1999 Form 10-K to be filed on or
about March 13, 2000.
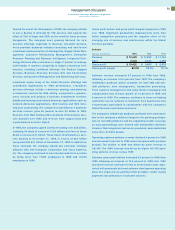
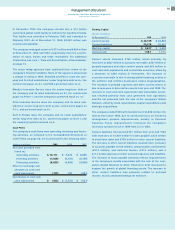
Results of Operations
(Dollars in millions
except per share amounts) 1999 1998 1997
Revenue $«87,548 $«81,667 $«78,508
Cost 55,619 50,795 47,899
Gross profit 31,929 30,872 30,609
Gross profit margin 36.4% 37.8% 39.0%
Total expense 20,172 21,832 21,582
Income before
income taxes $«11,757 $÷«9,040 $«««9,027
Net income $«««7,712 $«÷6,328 $«««6,093
Earnings per share of
common stock—
assuming dilution $«««««4.12 $÷÷«3.29 $«««««3.00
Earnings per share of
common stock—basic $«««««4.25 $÷÷«3.38 $÷÷«3.09
Revenue in 1999 grew 7.2 percent. Growth in Global Services,
personal computers, microelectronics and middleware soft-
ware products drove the increase, partially offset by lower
server revenue.
52