IBM 1999 Annual Report Download - page 93
Download and view the complete annual report
Please find page 93 of the 1999 IBM annual report below. You can navigate through the pages in the report by either clicking on the pages listed below, or by using the keyword search tool below to find specific information within the annual report.-
 1
1 -
2
-
3
-
4
-
5
-
6
-
7
-
8
-
9
-
10
-
11
-
12
-
13
-
14
-
15
-
16
-
17
-
18
-
19
-
20
-
21
-
22
-
23
-
24
-
25
-
26
-
27
-
28
-
29
-
30
-
31
-
32
-
33
-
34
-
35
-
36
-
37
-
38
-
39
-
40
-
41
-
42
-
43
-
44
-
45
-
46
-
47
-
48
-
49
-
50
-
51
-
52
-
53
-
54
-
55
-
56
-
57
-
58
-
59
-
60
-
61
-
62
-
63
-
64
-
65
-
66
-
67
-
68
-
69
-
70
-
71
-
72
-
73
-
74
-
75
-
76
-
77
-
78
-
79
-
80
-
81
-
82
-
 83
83 -
 84
84 -
 85
85 -
 86
86 -
 87
87 -
 88
88 -
 89
89 -
 90
90 -
 91
91 -
 92
92 -
 93
93 -
 94
94 -
 95
95 -
 96
96 -
 97
97 -
 98
98 -
 99
99 -
 100
100
 |
 |

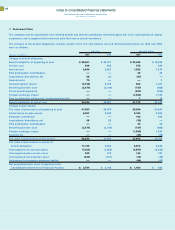
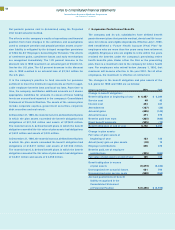
MANAGEMENT SYSTEM SEGMENT VIEW
Hardware
Personal Global Global Enterprise Total
(Dollars in millions) Technology Systems Server Services Software Financing Investments Segments
1999:
External revenue «$«12,597 $«15,290 $«««8,718 $«32,172 $«12,662 $«3,219 $«2,499 $«87,157
Internal revenue 3,800 45 326 2,636 767 835 19 8,428
Total revenue $«16,397 $«15,335 $«««9,044 $«34,808 $«13,429 $«4,054 $«2,518 $«95,585
Pre-tax income ÷÷««$««««««764 $÷÷«(557) $«««1,590 $÷«4,528 $«««2,830 $«1,286 $«««(324) $«10,117
Revenue year-to-year change (0.4) %% 19.8% (18.3) % 9.9% 6.5% 7.5% (0.2) % 5.1%
Pre-tax income year-
to-year change (20.0) % 43.9% (44.1) % 20.5% 9.4% 10.4% 47.4% 4.3%
Pre-tax income margin 4.7%% (3.6) % 17.6% 13.0% 21.1% 31.7% (12.9) % 10.6%
1998:
External revenue «$«11,890 $«12,776 $«10,624 $«28,916 $«11,863 $«2,979 $«2,468 $«81,516
Internal revenue 4,578 29 445 2,747 749 792 56 9,396
Total revenue $«16,468 $«12,805 $«11,069 $«31,663 $«12,612 $«3,771 $«2,524 $«90,912
Pre-tax income ÷÷««$««««««955 $÷÷«(992) $«««2,842 $÷«3,757 $«««2,588 $«1,165 $«««(616) $«««9,699
Revenue year-to-year change (4.4) %% (10.8) % (6.0) % 13.5% 6.6% 5.8% 0.6% 2.0%
Pre-tax income year-
to-year change (47.1) % (516.1) % (1.9) % 30.0% 27.2% 3.0% 32.3% 0.1%
Pre-tax income margin 5.8%% (7.7) % 25.7% 11.9% 20.5% 30.9% (24.4) % 10.7%
1997 :
External revenue «$«11,083 $«14,337 $«11,286 $«25,166 $«11,164 $«2,935 $«2,438 $«78,409
Internal revenue 6,147 20 491 2,737 671 628 70 10,764
Total revenue $«17,230 $«14,357 $«11,777 $«27,903 $«11,835 $«3,563 $«2,508 $«89,173
Pre-tax income $«««1,806 $÷÷«(161) $«««2,896 $«««2,890 $«««2,034 $«1,131 $÷«(910) $÷«9,686
Revenue year-to-year change 0.3% 3.3% (6.9) % 12.6% (1.5) % (3.3) % 5.0% 3.0%
Pre-tax income year-
to-year change 17.7% (312.8) % (12.1) % 14.3% (17.5) % (10.2) % (17.4) % (5.7) %
Pre-tax income margin 10.5% (1.1) % 24.6% 10.4% 17.2% 31.7% (36.3) % 10.9%
notes to consolidated financial statements
International Business Machines Corporation
and Subsidiary Companies
91
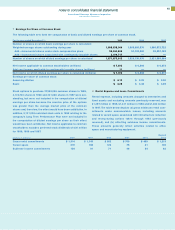
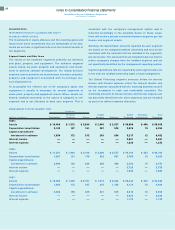
Reconciliations to IBM as Reported
(Dollars in millions) 1999 1998 1997
REVENUE:
Total reportable segments $«95,585 $«90,912 $«89,173
Other revenues 391 151 99
Elimination of internal
revenue (8,428) (9,396) (10,764)
Total IBM Consolidated $«87,548 $«81,667 $«78,508
(Dollars in millions) 1999 1998 1997
PRE-TAX INCOME:
Total reportable segments $«10,117 $«9,699 $«9,686
Elimination of internal
transactions (145) (162) (377)
Sale of Global Network 4,057 ——
1999 actions (2,205) ——
Unallocated corporate
expenses (67) (497) (282)
Total IBM Consolidated $«11,757 $«9,040 $«9,027