IBM 1999 Annual Report Download - page 76
Download and view the complete annual report
Please find page 76 of the 1999 IBM annual report below. You can navigate through the pages in the report by either clicking on the pages listed below, or by using the keyword search tool below to find specific information within the annual report.-
 1
1 -
2
-
3
-
4
-
5
-
6
-
7
-
8
-
9
-
10
-
11
-
12
-
13
-
14
-
15
-
16
-
17
-
18
-
19
-
20
-
21
-
22
-
23
-
24
-
25
-
26
-
27
-
28
-
29
-
30
-
31
-
32
-
33
-
34
-
35
-
36
-
37
-
38
-
39
-
40
-
41
-
42
-
43
-
44
-
45
-
46
-
47
-
48
-
49
-
50
-
51
-
52
-
53
-
54
-
55
-
56
-
57
-
58
-
59
-
60
-
61
-
62
-
63
-
64
-
65
-
 66
66 -
 67
67 -
 68
68 -
 69
69 -
 70
70 -
 71
71 -
 72
72 -
 73
73 -
 74
74 -
 75
75 -
 76
76 -
 77
77 -
 78
78 -
 79
79 -
 80
80 -
 81
81 -
 82
82 -
 83
83 -
 84
84 -
 85
85 -
 86
86 -
87
-
88
-
89
-
90
-
91
-
92
-
93
-
94
-
95
-
96
-
97
-
98
-
99
-
100
 |
 |

notes to consolidated financial statements
International Business Machines Corporation
and Subsidiary Companies
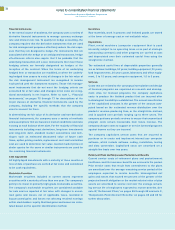
74
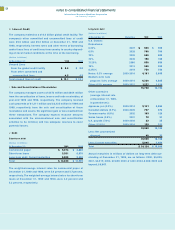
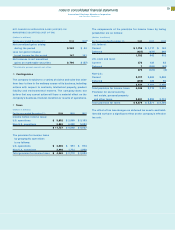
H Lines of Credit
The company maintains a $10.0 billion global credit facility. The
company’s other committed and uncommitted lines of credit
were $5.5 billion and $5.2 billion at December 31, 1999 and
1998, respectively. Interest rates and other terms of borrowing
under these lines of credit vary from country to country depend-
ing on local market conditions at the time of the borrowing.
(Dollars in billions)
At December 31: 1999 1998
Unused Lines
From the global credit facility $«««8.6 $«««8.8
From other committed and
uncommitted lines 4.5 4.3
Total unused lines of credit $«13.1 $«13.1
I Sale and Securitization of Receivables
The company manages assets of $273 million and $864 million
from the securitization of loans, leases and trade receivables, at
year-end 1999 and 1998, respectively. The company received
cash proceeds of $1,311 million and $2,425 million in 1999 and
1998, respectively, from the sale and securitization of these
receivables and assets. No significant gain or loss resulted from
these transactions. The company expects recourse amounts
associated with the aforementioned sale and securitization
activities to be minimal, and has adequate reserves to cover
potential losses.
J Debt
Short-term debt
(Dollars in millions)
At December 31: 1999 1998
Commercial paper $«««5,074 $«««4,885
Short-term loans 3,351 6,370
Long-term debt: Current maturities 5,805 2,650
Total $«14,230 $«13,905
The weighted-average interest rates for commercial paper at
December 31, 1999 and 1998, were 5.9 percent and 5.7 percent,
respectively. The weighted-average interest rates for short-term
loans at December 31, 1999 and 1998, were 4.0 percent and
5.3 percent, respectively.
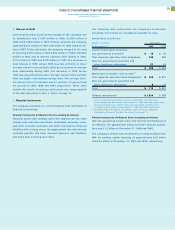
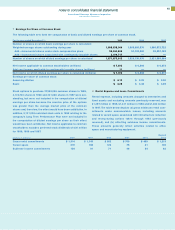
Long-term debt
(Dollars in millions)
At December 31: Maturities 1999 1998
U.S. Dollars:
Debentures:
6.22% 2027 $««««««500 $««««««500
6.5% 2028 700 700
7.0% 2025 600 600
7.0% 2045 150 150
7.125% 2096 850 850
7.5% 2013 550 550
8.375% 2019 750 750
Notes: 6.3% average 2000-2014 4,191 2,695
Medium-term note
program: 5.8% average 2000-2014 6,230 4,885
Other: 6.5% average 2000-2012 1,227 1,514
15,748 13,194
Other currencies
(average interest rate
at December 31, 1999,
in parentheses):
Japanese yen (3.0%) 2000-2014 3,141 3,866
Canadian dollars (5.7%) 2000-2005 707 672
German marks (4.9%) 2002 103 120
Swiss francs (2.5%) 2001 78 91
U.K. pounds (7.0%) 2000-2003 33 25
Other (13.6%) 2000-2014 159 221
19,969 18,189
Less: Net unamortized
discount 40 31
19,929 18,158
Less: Current maturities 5,805 2,650
Total $«14,124 $«15,508
Annual maturities in millions of dollars on long-term debt out-
standing at December 31, 1999, are as follows: 2000, $5,805;
2001, $2,915; 2002, $2,659; 2003, $1,234; 2004, $489; 2005 and
beyond, $6,867.