IBM 1999 Annual Report Download - page 58
Download and view the complete annual report
Please find page 58 of the 1999 IBM annual report below. You can navigate through the pages in the report by either clicking on the pages listed below, or by using the keyword search tool below to find specific information within the annual report.-
 1
1 -
2
-
3
-
4
-
5
-
6
-
7
-
8
-
9
-
10
-
11
-
12
-
13
-
14
-
15
-
16
-
17
-
18
-
19
-
20
-
21
-
22
-
23
-
24
-
25
-
26
-
27
-
28
-
29
-
30
-
31
-
32
-
33
-
34
-
35
-
36
-
37
-
38
-
39
-
40
-
41
-
42
-
43
-
44
-
45
-
46
-
47
-
 48
48 -
 49
49 -
 50
50 -
 51
51 -
 52
52 -
 53
53 -
 54
54 -
 55
55 -
 56
56 -
 57
57 -
 58
58 -
 59
59 -
 60
60 -
 61
61 -
 62
62 -
 63
63 -
 64
64 -
 65
65 -
 66
66 -
 67
67 -
 68
68 -
69
-
70
-
71
-
72
-
73
-
74
-
75
-
76
-
77
-
78
-
79
-
80
-
81
-
82
-
83
-
84
-
85
-
86
-
87
-
88
-
89
-
90
-
91
-
92
-
93
-
94
-
95
-
96
-
97
-
98
-
99
-
100
 |
 |

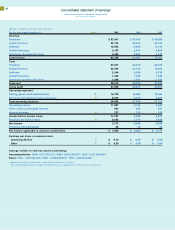
management discussion
International Business Machines Corporation
and Subsidiary Companies
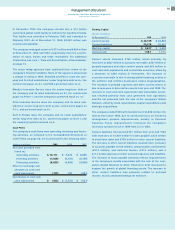
Global Financing
(Dollars in millions) 1999 1998 1997
Revenue $«3,137 $«2,877 $«2,806
Cost 1,446 1,494 1,448
Gross profit $«1,691 $«1,383 $«1,358
Gross profit margin 53.9% 48.1% 48.4%
Global Financing revenue increased 9.0 percent in 1999 from
1998, following an increase of 2.5 percent in 1998 versus 1997.
Growth in working capital financing, along with continued
growth in financing of software and services, drove the revenue
increase in 1999. Financing originations increased to approxi-
mately $43 billion, with year-to-year growth in working capital
financing, along with software and services financing. The reve-
nue increase in 1998 over 1997 was due to improved sales of
used equipment and growth in software and services financing,
offset by a decline in working capital financing.
Gross profit dollars increased 22.3 percent in 1999 versus 1998,
following an increase of 1.8 percent in 1998 over 1997. The
increase in 1999 reflects Global Financing’s ongoing strategy to
increase its use of the company’s Global Treasury Centers
rather than external banks as a funding source and lower costs
of borrowing. The increase in gross profit dollars in 1998 versus
1997 was primarily due to increased revenue and a higher gross
profit margin in the U.S. markets.
Enterprise Investments/ Other
(Dollars in millions) 1999 1998 1997
Revenue $«2,536 $«2,592 $«2,742
Cost 1,558 1,702 1,729
Gross profit $««««978 $««««890 $«1,013
Gross profit margin 38.6% 34.3% 36.9%
Enterprise Investments/ Other revenue decreased 2.2 percent
from 1998, following a decrease of 5.5 percent in 1998 from 1997.
The decrease was driven by lower revenue from discontin-
ued product lines, such as automated teller machines (ATMs),
partially offset by growth in point-of-sale terminals and computer-
aided three-dimensional interactive application (CATIA) software.
The decrease in 1998 versus 1997 was primarily a result of lower
software revenue, partially offset by higher revenue from point-
of-sale terminals.
The gross profit dollars from Enterprise Investments/ Other
increased 9.9 percent in 1999 versus 1998, following a decrease
of 12.1 percent in 1998 versus 1997. The increase in 1999 gross
profit dollars and gross profit margin was primarily driven by an
improving gross profit margin for point-of-sale terminals and
software. The decline in 1998 gross profit dollars and gross
profit margin was primarily driven by the lower software reve-
nue versus 1997.
Operating Expenses
(Dollars in millions) 1999 1998 1997
Selling, general and
administrative $«14,729 $«16,662 $«16,634
Percentage of revenue 16.8% 20.4% 21.2%
Research, development
and engineering $«««5,273 $«««5,046 $«««4,877
Percentage of revenue 6.0% 6.2% 6.2%
Selling, general and administrative (SG&A) expense declined
11.6 percent in 1999 versus 1998 and was essentially flat in
1998 with 1997. The decrease in 1999 reflects the net pre-tax
benefit associated with the sale of the Global Network and the
actions taken by the company in 1999 to improve its competi-
tiveness and to strengthen further the company’s overall business
portfolio. (See note D, “Acquisitions/ Divestitures,” on pages 72
and 73, and note R, “1999 Actions,” on pages 81 and 82 for fur-
ther information.)
The company continues to manage aggressively its infrastructure
expense and its overall portfolio to allow for investment in growth
areas of the business. Key ongoing investments include soft-
ware marketing, major marketing campaigns, and new offerings
for small and medium business opportunities, as well as the
e-business campaign. These types of expenditures are consis-
tent with the company’s ongoing objective of growing revenue
while improving the expense-to-revenue ratio over time.
Research, development and engineering expense increased
4.5 percent in 1999 from 1998, following an increase of 3.5 per-
cent in 1998 from 1997. The increase in 1999 reflects additional
expenses associated with the acquisition of Sequent Computer
Systems, Inc., Mylex Corporation and DASCOM, Inc. Those
acquisitions are intended to improve the company’s long-term
56