IBM 1999 Annual Report Download - page 85
Download and view the complete annual report
Please find page 85 of the 1999 IBM annual report below. You can navigate through the pages in the report by either clicking on the pages listed below, or by using the keyword search tool below to find specific information within the annual report.-
 1
1 -
2
-
3
-
4
-
5
-
6
-
7
-
8
-
9
-
10
-
11
-
12
-
13
-
14
-
15
-
16
-
17
-
18
-
19
-
20
-
21
-
22
-
23
-
24
-
25
-
26
-
27
-
28
-
29
-
30
-
31
-
32
-
33
-
34
-
35
-
36
-
37
-
38
-
39
-
40
-
41
-
42
-
43
-
44
-
45
-
46
-
47
-
48
-
49
-
50
-
51
-
52
-
53
-
54
-
55
-
56
-
57
-
58
-
59
-
60
-
61
-
62
-
63
-
64
-
65
-
66
-
67
-
68
-
69
-
70
-
71
-
72
-
73
-
74
-
 75
75 -
 76
76 -
 77
77 -
 78
78 -
 79
79 -
 80
80 -
 81
81 -
 82
82 -
 83
83 -
 84
84 -
 85
85 -
 86
86 -
 87
87 -
 88
88 -
 89
89 -
 90
90 -
 91
91 -
 92
92 -
 93
93 -
 94
94 -
 95
95 -
96
-
97
-
98
-
99
-
100
 |
 |

notes to consolidated financial statements
International Business Machines Corporation
and Subsidiary Companies
83
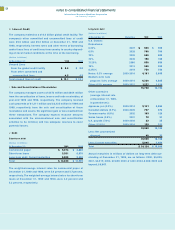
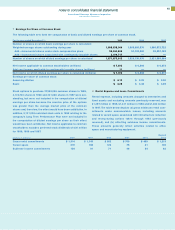
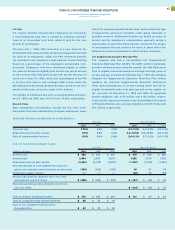
T Earnings Per Share of Common Stock
The following table sets forth the computation of basic and diluted earnings per share of common stock.
For the year ended December 31: 1999 1998 1997
Number of shares on which basic earnings per share is calculated:
Weighted-average shares outstanding during year 1,808,538,346 1,869,005,570 1,966,572,722
Add—Incremental shares under stock compensation plans 59,344,849 51,124,900 55,297,162
Add—Incremental shares associated with contingently issuable shares 3,190,717 ——
Number of shares on which diluted earnings per share is calculated 1,871,073,912 1,920,130,470 2,021,869,884
Net income applicable to common stockholders (millions) $«7,692 $«6,308 $«6,073
Add—net income applicable to contingently issuable shares (millions) 11 ——
Net income on which diluted earnings per share is calculated (millions) $«7,703 $«6,308 $«6,073
Earnings per share of common stock:
Assuming dilution $«««4.12 $«««3.29 $«««3.00
Basic $«««4.25 $«««3.38 $«««3.09
Stock options to purchase 27,355,056 common shares in 1999,
4,124,730 shares in 1998 and 331,666 shares in 1997 were out-
standing, but were not included in the computation of diluted
earnings per share because the exercise price of the options
was greater than the average market price of the common
shares and, therefore, the effect would have been antidilutive. In
addition, 5,131,038 restricted stock units in 1998 relating to the
company’s Long Term Performance Plan were not included in
the computation of diluted earnings per share as their effect
would have been antidilutive. Net income applicable to common
stockholders excludes preferred stock dividends of $20 million
for 1999, 1998 and 1997.
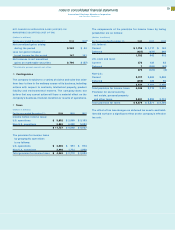
U Rental Expense and Lease Commitments
Rental expense, including amounts charged to inventories and
fixed assets and excluding amounts previously reserved, was
$1,397 million in 1999, $1,431 million in 1998 and $1,280 million
in 1997. The table below depicts (a) gross minimum rental com-
mitments under noncancelable leases, including amounts
related to vacant space associated with infrastructure reduction
and restructuring actions taken through 1993 (previously
reserved), and (b) offsetting sublease income commitments.
These amounts generally reflect activities related to office
space and manufacturing equipment.
Beyond
(Dollars in millions) 2000 2001 2002 2003 2004 2004
Gross rental commitments $«1,314 $«1,143 $«982 $«769 $«469 $«1,213
Vacant space 219 168 122 75 41 130
Sublease income commitments 124 91 71 48 34 62