IBM 1999 Annual Report Download - page 56
Download and view the complete annual report
Please find page 56 of the 1999 IBM annual report below. You can navigate through the pages in the report by either clicking on the pages listed below, or by using the keyword search tool below to find specific information within the annual report.-
 1
1 -
2
-
3
-
4
-
5
-
6
-
7
-
8
-
9
-
10
-
11
-
12
-
13
-
14
-
15
-
16
-
17
-
18
-
19
-
20
-
21
-
22
-
23
-
24
-
25
-
26
-
27
-
28
-
29
-
30
-
31
-
32
-
33
-
34
-
35
-
36
-
37
-
38
-
39
-
40
-
41
-
42
-
43
-
44
-
45
-
 46
46 -
 47
47 -
 48
48 -
 49
49 -
 50
50 -
 51
51 -
 52
52 -
 53
53 -
 54
54 -
 55
55 -
 56
56 -
 57
57 -
 58
58 -
 59
59 -
 60
60 -
 61
61 -
 62
62 -
 63
63 -
 64
64 -
 65
65 -
 66
66 -
67
-
68
-
69
-
70
-
71
-
72
-
73
-
74
-
75
-
76
-
77
-
78
-
79
-
80
-
81
-
82
-
83
-
84
-
85
-
86
-
87
-
88
-
89
-
90
-
91
-
92
-
93
-
94
-
95
-
96
-
97
-
98
-
99
-
100
 |
 |

management discussion
International Business Machines Corporation
and Subsidiary Companies
54
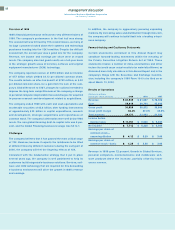
Server revenue declined 17.9 percent in 1999 from 1998, following
a decrease of 5.9 percent in 1998 versus 1997. S/ 390 revenue
declined in 1999 as customers completed the task of making
Y2Kready the mainframe computers that they use in data
centers to run mission critical, highly integrated enterprise-
wide applications with large transaction volumes. Once the
systems were Y2Ktested and ready, customers were not
inclined to enhance them because of concerns about affecting
their Y2Kreadiness. AS/ 400 revenue declined due to a slow-
down in sales related to Enterprise Resource Planning (ERP)
solutions because of Y2Kconcerns. RS/ 6000 revenue declined
for SP-2 and entry models, partially offset by the enterprise
servers which had strong revenue growth in 1999.
Lower revenue from
S
/ 390,
AS
/ 400 and
RS
/ 6000 drove the
5.9 percent decrease in revenue in
19
98 versus
19
97. While
S
/ 390 revenue declined, total delivery of computing power
increased more than 60 percent as measured in
MIPS
(millions of instructions per second) versus
19
97. Product
transitions late in
19
98 affected the revenue for
AS
/ 400 and
RS
/ 6000 in
19
98 versus
19
97.
In January 2000, the Server Group reorganized to become the
Enterprise Systems Group and adopted a market-centric
alignment to help customers connect and integrate S/ 390,
AS/ 400, RS/ 6000, NUMA-Q and Netfinity servers to support a
wider variety of applications. The reorganized group will focus
on cross-server customer requirements for Web servers,
enterprise servers, mid-market servers, and for storage sub-
systems across all computing environments.
During the year, the company signed major technology contracts
with Dell Computer Corporation (for the purchase of personal
computer parts from the company over seven years), Acer
Incorporated (technology purchase contract over seven years),
EMC Corporation (five-year strategic technology and business
alliance), Cisco Systems, Inc. (technology purchase over five
years) and Nintendo Company, Ltd. (multi-year contract to pur-
chase technology). The total of these contracts could be in
excess of $15 billion.
Hardware gross profit dollars decreased 11.0 percent in 1999
from 1998, following a 14.8 percent decrease in 1998 versus
1997. In 1999, the shift in the company’s revenue away from
servers, pricing pressures associated with HDDs and memory
chip prices drove the declines in gross profit dollars from 1998.
A lower model mix in the mobile HDDs (in which some cus-
tomers are meeting their capacity needs with new mid-range
products, rather than with the more profitable high-end mobile
products) also had a negative effect on gross profit dollars. The
decline in gross profit dollars in 1998 was primarily driven by
lower margins associated with significant price reductions in
Personal Systems products.
Hardware gross profit margin decreases in 1999 versus 1998
and 1998 versus 1997 continued to be driven by the shift in the
company’s revenue away from servers to lower gross profit
products, such as personal computers, OEM chip technology
and HDDs, as well as price pressures.
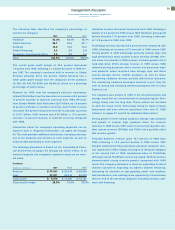
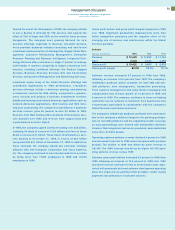
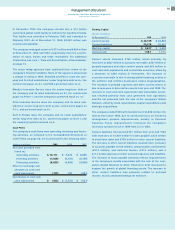
Global Services
(Dollars in millions) 1999 1998 1997
Revenue $«32,172 $«28,916 $«25,166
Cost 23,304 21,125 18,464
Gross profit $«««8,868 $«««7,791 $«««6,702
Gross profit margin 27.6% 26.9% 26.6%
Global Services revenue increased 11.3 percent in 1999 from
1998 and 14.9 percent in 1998 over 1997. Revenue growth in
1999 without the effect of the sale of the company’s Global
Network to AT&Twould have been 13 percent. (See note D,
“Acquisitions/ Divestitures,” on pages 72 and 73 for additional
information about this sale.)
While maintenance revenues declined 1 percent, reflecting
con
tinued price pressures as customers transitioned to new
technologies, services rev
enue excluding maintenance and the
effect of the sale of the Global Network grew 17 percent.
Strategic Outsourcing Services was a major contributor to this
performance. Strategic Outsourcing Services creates business
value through long-term strategic partnerships with customers
by taking on responsibility for their processes and systems.
Business Innovation Services (formerly Systems Integration
and Consulting) and Integrated Technology Services (formerly
Product Support Services) performance was strong through the
first nine months of 1999 but slowed in the fourth quarter due
to the effect of Y2K-related customer lockdowns and a slow-
down in Y2Kservices.