IBM 1999 Annual Report Download - page 81
Download and view the complete annual report
Please find page 81 of the 1999 IBM annual report below. You can navigate through the pages in the report by either clicking on the pages listed below, or by using the keyword search tool below to find specific information within the annual report.-
 1
1 -
2
-
3
-
4
-
5
-
6
-
7
-
8
-
9
-
10
-
11
-
12
-
13
-
14
-
15
-
16
-
17
-
18
-
19
-
20
-
21
-
22
-
23
-
24
-
25
-
26
-
27
-
28
-
29
-
30
-
31
-
32
-
33
-
34
-
35
-
36
-
37
-
38
-
39
-
40
-
41
-
42
-
43
-
44
-
45
-
46
-
47
-
48
-
49
-
50
-
51
-
52
-
53
-
54
-
55
-
56
-
57
-
58
-
59
-
60
-
61
-
62
-
63
-
64
-
65
-
66
-
67
-
68
-
69
-
70
-
 71
71 -
 72
72 -
 73
73 -
 74
74 -
 75
75 -
 76
76 -
 77
77 -
 78
78 -
 79
79 -
 80
80 -
 81
81 -
 82
82 -
 83
83 -
 84
84 -
 85
85 -
 86
86 -
 87
87 -
 88
88 -
 89
89 -
 90
90 -
 91
91 -
92
-
93
-
94
-
95
-
96
-
97
-
98
-
99
-
100
 |
 |

notes to consolidated financial statements
International Business Machines Corporation
and Subsidiary Companies
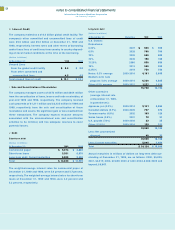
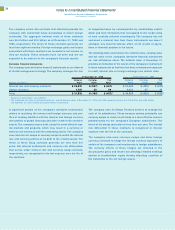
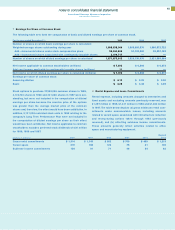
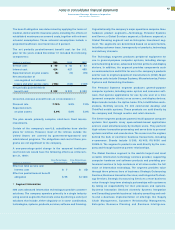
NET CHANGE IN UNREALIZED GAINS (LOSSES) ON
MARKETABLE SECURITIES (NET OF TAX)
(Dollars in millions)
For the year ended December 31: 1999 1998**
Net unrealized gains arising
during the period $«943 $÷44
Less net gains included
in net income for the period 147 101
Net increase in net unrealized
gains on marketable securities $«796 $«(57)
*Restated to present amounts net of tax.
O Contingencies
The company is subject to a variety of claims and suits that arise
from time to time in the ordinary course of its business, including
actions with respect to contracts, intellectual property, product
liability and environmental matters. The company does not
believe that any current action will have a material effect on the
company’s business, financial condition or results of operations.
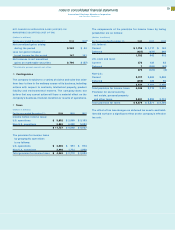
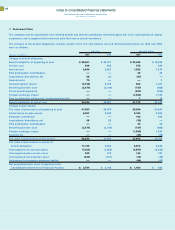
P Taxes
(Dollars in millions)
For the year ended December 31: 1999 1998 1997
Income before income taxes:
U.S. operations $«««5,892 $«2,960 $«3,193
Non-U.S. operations 5,865 6,080 5,834
$«11,757 $«9,040 $«9,027
The provision for income taxes
by geographic operations
is as follows:
U.S. operations «$«««2,005 $««««991 $««««974
Non-U.S. operations 2,040 1,721 1,960
Total provision for income taxes $«««4,045 $«2,712 $«2,934
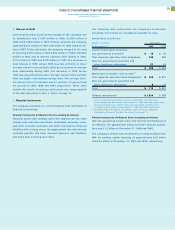
The components of the provision for income taxes by taxing
jurisdiction are as follows:
(Dollars in millions)
For the year ended December 31: 1999 1998 1997
U.S. federal:
Current $«1,759 $«1,117 $««««163
Deferred (427) (475) 349
1,332 642 512
U.S. state and local:
Current 272 139 83
Deferred 7(260) (87)
279 (121) (4)
Non-U.S.:
Current 2,727 2,062 2,330
Deferred (293) 129 96
2,434 2,191 2,426
Total provision for income taxes 4,045 2,712 2,934
Provision for social security,
real estate, personal property
and other taxes 2,831 2,859 2,774
Total provision for taxes $«6,876 $«5,571 $«5,708
The effect of tax law changes on deferred tax assets and liabil-
ities did not have a significant effect on the company’s effective
tax rate.
79