HP 2011 Annual Report Download - page 71
Download and view the complete annual report
Please find page 71 of the 2011 HP annual report below. You can navigate through the pages in the report by either clicking on the pages listed below, or by using the keyword search tool below to find specific information within the annual report.-
 1
1 -
2
-
3
-
4
-
5
-
6
-
7
-
8
-
9
-
10
-
11
-
12
-
13
-
14
-
15
-
16
-
17
-
18
-
19
-
20
-
21
-
22
-
23
-
24
-
25
-
26
-
27
-
28
-
29
-
30
-
31
-
32
-
33
-
34
-
35
-
36
-
37
-
38
-
39
-
40
-
41
-
42
-
43
-
44
-
45
-
46
-
47
-
48
-
49
-
50
-
51
-
52
-
53
-
54
-
55
-
56
-
57
-
58
-
59
-
60
-
 61
61 -
 62
62 -
 63
63 -
 64
64 -
 65
65 -
 66
66 -
 67
67 -
 68
68 -
 69
69 -
 70
70 -
 71
71 -
 72
72 -
 73
73 -
 74
74 -
 75
75 -
 76
76 -
 77
77 -
 78
78 -
 79
79 -
 80
80 -
 81
81 -
82
-
83
-
84
-
85
-
86
-
87
-
88
-
89
-
90
-
91
-
92
-
93
-
94
-
95
-
96
-
97
-
98
-
99
-
100
-
101
-
102
-
103
-
104
-
105
-
106
-
107
-
108
-
109
-
110
-
111
-
112
-
113
-
114
-
115
-
116
-
117
-
118
-
119
-
120
-
121
-
122
-
123
-
124
-
125
-
126
-
127
-
128
-
129
-
130
-
131
-
132
-
133
-
134
-
135
-
136
-
137
-
138
-
139
-
140
-
141
-
142
-
143
-
144
-
145
-
146
-
147
-
148
-
149
-
150
-
151
-
152
-
153
-
154
-
155
-
156
-
157
-
158
-
159
-
160
-
161
-
162
-
163
-
164
-
165
-
166
-
167
-
168
-
169
-
170
-
171
-
172
-
173
-
174
-
175
-
176
-
177
-
178
-
179
-
180
-
181
-
182
 |
 |

HEWLETT-PACKARD COMPANY AND SUBSIDIARIES
Management’s Discussion and Analysis of
Financial Condition and Results of Operations (Continued)
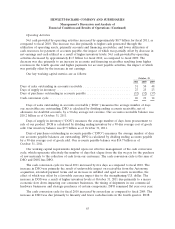
Operating Activities
Net cash provided by operating activities increased by approximately $0.7 billion for fiscal 2011, as
compared to fiscal 2010. The increase was due primarily to higher cash generated through the
utilization of operating assets, primarily accounts and financing receivables, and lower utilization of
cash resources for payment of accounts payable, the impact of which was partially offset by decrease in
net earnings and cash utilized as a result of higher inventory levels. Net cash provided by operating
activities decreased by approximately $1.5 billion for fiscal 2010, as compared to fiscal 2009. The
decrease was due primarily to an increase in accounts and financing receivables resulting from higher
revenues in the fourth quarter and higher payments for account payable activities, the impact of which
was partially offset by the increase in net earnings.
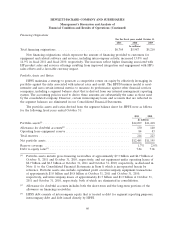
Our key working capital metrics are as follows:
October 31
2011 2010 2009
Days of sales outstanding in accounts receivable ........................... 51 50 48
Days of supply in inventory .......................................... 27 23 23
Days of purchases outstanding in accounts payable ......................... (52) (52) (57)
Cash conversion cycle .............................................. 26 21 14
Days of sales outstanding in accounts receivable (‘‘DSO’’) measures the average number of days
our receivables are outstanding. DSO is calculated by dividing ending accounts receivable, net of
allowance for doubtful accounts, by a 90-day average net revenue. Our accounts receivable balance was
$18.2 billion as of October 31, 2011.
Days of supply in inventory (‘‘DOS’’) measures the average number of days from procurement to
sale of our product. DOS is calculated by dividing ending inventory by a 90-day average cost of goods
sold. Our inventory balance was $7.5 billion as of October 31, 2011.
Days of purchases outstanding in accounts payable (‘‘DPO’’) measures the average number of days
our accounts payable balances are outstanding. DPO is calculated by dividing ending accounts payable
by a 90-day average cost of goods sold. Our accounts payable balance was $14.7 billion as of
October 31, 2011.
Our working capital requirements depend upon our effective management of the cash conversion
cycle, which represents effectively the number of days that elapse from the day we pay for the purchase
of raw materials to the collection of cash from our customers. The cash conversion cycle is the sum of
DSO and DOS less DPO.
The cash conversion cycle for fiscal 2011 increased by five days as compared to fiscal 2010. The
increase in DSO was primarily the result of unfavorable impact on receivables from the Autonomy
acquisition, extended payment terms and an increase in unbilled and aged accounts receivables, the
effect of which was offset by a favorable currency impact due to the strengthening U.S. dollar. The
increase in DOS was a result of higher inventory levels at October 31, 2011 due primarily to a macro
economic slow down impacting our consumer businesses, the timing of shipments in our commercial
hardware businesses and strategic purchases of certain components. DPO remained flat year over year.
The cash conversion cycle for fiscal 2010 increased by seven days as compared to fiscal 2009. The
increase in DSO was due primarily to linearity and fewer cash discounts in the fourth quarter. DOS
63