HP 2011 Annual Report Download - page 59
Download and view the complete annual report
Please find page 59 of the 2011 HP annual report below. You can navigate through the pages in the report by either clicking on the pages listed below, or by using the keyword search tool below to find specific information within the annual report.-
 1
1 -
2
-
3
-
4
-
5
-
6
-
7
-
8
-
9
-
10
-
11
-
12
-
13
-
14
-
15
-
16
-
17
-
18
-
19
-
20
-
21
-
22
-
23
-
24
-
25
-
26
-
27
-
28
-
29
-
30
-
31
-
32
-
33
-
34
-
35
-
36
-
37
-
38
-
39
-
40
-
41
-
42
-
43
-
44
-
45
-
46
-
47
-
48
-
 49
49 -
 50
50 -
 51
51 -
 52
52 -
 53
53 -
 54
54 -
 55
55 -
 56
56 -
 57
57 -
 58
58 -
 59
59 -
 60
60 -
 61
61 -
 62
62 -
 63
63 -
 64
64 -
 65
65 -
 66
66 -
 67
67 -
 68
68 -
 69
69 -
70
-
71
-
72
-
73
-
74
-
75
-
76
-
77
-
78
-
79
-
80
-
81
-
82
-
83
-
84
-
85
-
86
-
87
-
88
-
89
-
90
-
91
-
92
-
93
-
94
-
95
-
96
-
97
-
98
-
99
-
100
-
101
-
102
-
103
-
104
-
105
-
106
-
107
-
108
-
109
-
110
-
111
-
112
-
113
-
114
-
115
-
116
-
117
-
118
-
119
-
120
-
121
-
122
-
123
-
124
-
125
-
126
-
127
-
128
-
129
-
130
-
131
-
132
-
133
-
134
-
135
-
136
-
137
-
138
-
139
-
140
-
141
-
142
-
143
-
144
-
145
-
146
-
147
-
148
-
149
-
150
-
151
-
152
-
153
-
154
-
155
-
156
-
157
-
158
-
159
-
160
-
161
-
162
-
163
-
164
-
165
-
166
-
167
-
168
-
169
-
170
-
171
-
172
-
173
-
174
-
175
-
176
-
177
-
178
-
179
-
180
-
181
-
182
 |
 |
HEWLETT-PACKARD COMPANY AND SUBSIDIARIES
Management’s Discussion and Analysis of
Financial Condition and Results of Operations (Continued)
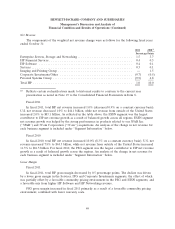
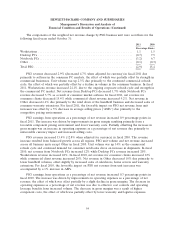
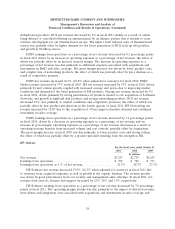
HP Software gross margin increased in fiscal 2010 primarily as a result of a higher license and
support mix, the effect of which was partially offset by a reduced services gross margin rate.
HPFS gross margin increased in fiscal 2010 primarily as a result of higher portfolio margins due to
favorable financing conditions and higher remarketing margin, the effect of which was partially offset
by higher bad debt and lower buyout margin.
Corporate Investments gross margin increased in fiscal 2010 primarily as a result of the impact
from the acquisition Palm, Inc. (‘‘Palm’’).
Operating Expenses
Research and Development
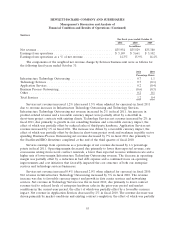
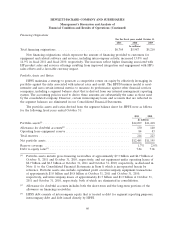
Total research and development (‘‘R&D’’) expense increased in fiscal 2011 due primarily to
additional expenses from acquired companies. In fiscal 2011, R&D expense increased for ESSN,
Corporate Investments and HP Software and decreased for Services and PSG. The increase for ESSN
was driven by acquisition investments and innovation-focused spend in networking and storage
products. The increase for Corporate Investments was due to investments in the development of
webOS and webOS devices during the first three quarters of fiscal 2011.
Total R&D expense increased in fiscal 2010 due primarily to additional expenses from acquired
companies. In fiscal 2010, R&D expense increased for ESSN, IPG, Corporate Investments, HP
Software and Services, and decreased for PSG.
Selling, General and Administrative
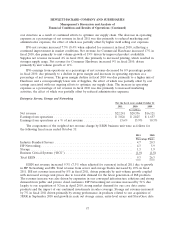
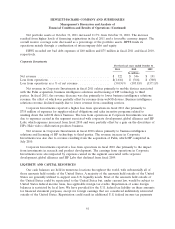
Selling, general and administrative (‘‘SG&A’’) expense increased in fiscal 2011 due primarily to
higher field selling costs as a result of our investments in sales resources to grow revenue. The increase
in fiscal 2011 was partially offset by $334 million in net gains on the sale of real estate and a
$77 million net gain on the divestiture of our Halo video collaboration products business. In fiscal 2011,
SG&A expense as a percentage of net revenue increased for each of our segments except for HPFS,
Services and IPG, each of which experienced a decrease.
Total SG&A expense increased in fiscal 2010 due primarily to higher field selling and marketing
costs as a result of our investments in sales resources to grow revenue. In fiscal 2010, SG&A expense
as a percentage of net revenue decreased for each of our segments except for IPG, which experienced
an increase.
Amortization of Purchased Intangible Assets
The increase in amortization expense in fiscal 2011 was due primarily to increased amortization of
purchased intangible assets from acquisitions completed during fiscal 2010. This increase was partially
offset by decreased amortization expenses related to certain intangible assets associated with prior
acquisitions reaching the end of their amortization periods.
The decrease in amortization expense in fiscal 2010 was due primarily to certain intangible assets
associated with prior acquisitions reaching the end of their amortization periods, the effect of which
was partially offset by increased amortization of purchased intangible assets from acquisitions
completed during fiscal 2010.
51