HP 2011 Annual Report Download - page 46
Download and view the complete annual report
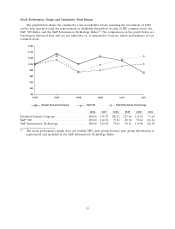
Please find page 46 of the 2011 HP annual report below. You can navigate through the pages in the report by either clicking on the pages listed below, or by using the keyword search tool below to find specific information within the annual report.-
 1
1 -
2
-
3
-
4
-
5
-
6
-
7
-
8
-
9
-
10
-
11
-
12
-
13
-
14
-
15
-
16
-
17
-
18
-
19
-
20
-
21
-
22
-
23
-
24
-
25
-
26
-
27
-
28
-
29
-
30
-
31
-
32
-
33
-
34
-
35
-
 36
36 -
 37
37 -
 38
38 -
 39
39 -
 40
40 -
 41
41 -
 42
42 -
 43
43 -
 44
44 -
 45
45 -
 46
46 -
 47
47 -
 48
48 -
 49
49 -
 50
50 -
 51
51 -
 52
52 -
 53
53 -
 54
54 -
 55
55 -
 56
56 -
57
-
58
-
59
-
60
-
61
-
62
-
63
-
64
-
65
-
66
-
67
-
68
-
69
-
70
-
71
-
72
-
73
-
74
-
75
-
76
-
77
-
78
-
79
-
80
-
81
-
82
-
83
-
84
-
85
-
86
-
87
-
88
-
89
-
90
-
91
-
92
-
93
-
94
-
95
-
96
-
97
-
98
-
99
-
100
-
101
-
102
-
103
-
104
-
105
-
106
-
107
-
108
-
109
-
110
-
111
-
112
-
113
-
114
-
115
-
116
-
117
-
118
-
119
-
120
-
121
-
122
-
123
-
124
-
125
-
126
-
127
-
128
-
129
-
130
-
131
-
132
-
133
-
134
-
135
-
136
-
137
-
138
-
139
-
140
-
141
-
142
-
143
-
144
-
145
-
146
-
147
-
148
-
149
-
150
-
151
-
152
-
153
-
154
-
155
-
156
-
157
-
158
-
159
-
160
-
161
-
162
-
163
-
164
-
165
-
166
-
167
-
168
-
169
-
170
-
171
-
172
-
173
-
174
-
175
-
176
-
177
-
178
-
179
-
180
-
181
-
182
 |
 |

HEWLETT-PACKARD COMPANY AND SUBSIDIARIES
Management’s Discussion and Analysis of
Financial Condition and Results of Operations (Continued)
choosing, be it in-house, outsourced as a service via the Internet or via a hybrid environment. Our
portfolio of management software completes the package by allowing our customers to manage their IT
operations in an efficient and cost-effective manner. In addition, we are working to optimize our supply
chain by eliminating complexity, reducing fixed costs, and leveraging our scale to ensure the availability
of components at favorable prices even during shortages. We are also expanding our use of industry
standard components in our enterprise products to further leverage our scale.
Investing in our Business
We are investing in our business to strengthen our position in our core markets and accelerate
growth in adjacent markets in anticipation of market trends, such as cloud computing, unstructured
data, data center consolidation and automation, digitization, analytics and IT security. We are also
creating innovative new products and developing new channels to connect with our customers. In
addition, we have been making focused investments to strengthen our portfolio of products and services
that we can offer to our customers, both through organic investments as well as through acquisitions.
These investments will allow us to expand in higher margin and higher growth industry segments and
further strengthen our portfolio of hardware, software and services.
Driving Operational Effectiveness
We are continuing to work to optimize operational effectiveness across the company. Operational
effectiveness remains critical to the success of HP, and we are implementing efficiency, productivity and
quality initiatives throughout the company. For example, we are continuing to execute our ongoing
initiatives to transform our supply chain and leverage our corporate infrastructure. We have also
adopted an initiative to implement better tools, standardize key processes, integrate critical IT systems,
minimize redundant or legacy systems and take other actions to improve our productivity, sales,
forecasting and business decisions. In addition, we are continuing to implement the multi-year
restructuring plan announced in June 2010 relating to our enterprise services business. See Note 8 to
the Consolidated Financial Statements in Item 8 for further discussion of this restructuring plan and
the associated restructuring charges.
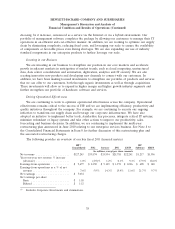
The following provides an overview of our key fiscal 2011 financial metrics:
HP(1) HP
Consolidated PSG Services IPG ESSN Software HPFS
In millions, except per share amounts
Net revenue .................... $127,245 $39,574 $35,954 $25,783 $22,241 $3,217 $3,596
Year-over-year net revenue % increase
(decrease) .................... 1.0% (2.9)% 1.2% 0.1% 9.3% 17.9% 18.0%
Earnings from operations ........... $ 9,677 $ 2,350 $ 5,149 $ 3,973 $ 3,026 $ 698 $ 348
Earnings from operations as a % of net
revenue ...................... 7.6% 5.9% 14.3% 15.4% 13.6% 21.7% 9.7%
Net earnings .................... $ 7,074
Net earnings per share
Basic ....................... $ 3.38
Diluted ...................... $ 3.32
(1) Includes Corporate Investments and eliminations.
38