HP 2011 Annual Report Download - page 163
Download and view the complete annual report
Please find page 163 of the 2011 HP annual report below. You can navigate through the pages in the report by either clicking on the pages listed below, or by using the keyword search tool below to find specific information within the annual report.-
 1
1 -
2
-
3
-
4
-
5
-
6
-
7
-
8
-
9
-
10
-
11
-
12
-
13
-
14
-
15
-
16
-
17
-
18
-
19
-
20
-
21
-
22
-
23
-
24
-
25
-
26
-
27
-
28
-
29
-
30
-
31
-
32
-
33
-
34
-
35
-
36
-
37
-
38
-
39
-
40
-
41
-
42
-
43
-
44
-
45
-
46
-
47
-
48
-
49
-
50
-
51
-
52
-
53
-
54
-
55
-
56
-
57
-
58
-
59
-
60
-
61
-
62
-
63
-
64
-
65
-
66
-
67
-
68
-
69
-
70
-
71
-
72
-
73
-
74
-
75
-
76
-
77
-
78
-
79
-
80
-
81
-
82
-
83
-
84
-
85
-
86
-
87
-
88
-
89
-
90
-
91
-
92
-
93
-
94
-
95
-
96
-
97
-
98
-
99
-
100
-
101
-
102
-
103
-
104
-
105
-
106
-
107
-
108
-
109
-
110
-
111
-
112
-
113
-
114
-
115
-
116
-
117
-
118
-
119
-
120
-
121
-
122
-
123
-
124
-
125
-
126
-
127
-
128
-
129
-
130
-
131
-
132
-
133
-
134
-
135
-
136
-
137
-
138
-
139
-
140
-
141
-
142
-
143
-
144
-
145
-
146
-
147
-
148
-
149
-
150
-
151
-
152
-
 153
153 -
 154
154 -
 155
155 -
 156
156 -
 157
157 -
 158
158 -
 159
159 -
 160
160 -
 161
161 -
 162
162 -
 163
163 -
 164
164 -
 165
165 -
 166
166 -
 167
167 -
 168
168 -
 169
169 -
 170
170 -
 171
171 -
 172
172 -
 173
173 -
174
-
175
-
176
-
177
-
178
-
179
-
180
-
181
-
182
 |
 |

HEWLETT-PACKARD COMPANY AND SUBSIDIARIES
Notes to Consolidated Financial Statements (Continued)
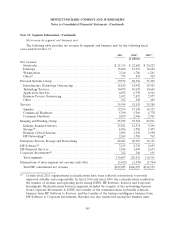
Note 19: Segment Information (Continued)
Net revenue by segment and business unit
The following table provides net revenue by segment and business unit for the following fiscal
years ended October 31:
2011 2010(1) 2009(1)
In millions
Net revenue:
Notebooks .......................................... $ 21,319 $ 22,602 $ 20,223
Desktops ........................................... 15,260 15,519 12,892
Workstations ........................................ 2,216 1,786 1,261
Other(2) ............................................ 779 834 929
Personal Systems Group ................................. 39,574 40,741 35,305
Infrastructure Technology Outsourcing ..................... 15,189 14,942 14,563
Technology Services ................................... 10,879 10,627 10,665
Application Services ................................... 6,852 6,792 6,926
Business Process Outsourcing ............................ 2,672 2,872 2,977
Other ............................................. 362 296 249
Services ............................................. 35,954 35,529 35,380
Supplies ........................................... 17,154 17,249 16,532
Commercial Hardware ................................. 5,790 5,569 4,778
Consumer Hardware .................................. 2,839 2,946 2,701
Imaging and Printing Group .............................. 25,783 25,764 24,011
Industry Standard Servers ............................... 13,521 12,574 9,296
Storage(3) ........................................... 4,056 3,785 3,473
Business Critical Systems ............................... 2,095 2,292 2,590
HP Networking(4) ..................................... 2,569 1,705 762
Enterprise Servers, Storage and Networking ................... 22,241 20,356 16,121
HP Software(5) ........................................ 3,217 2,729 2,655
HP Financial Services ................................... 3,596 3,047 2,673
Corporate Investments(6) ................................. 322 346 191
Total segments ....................................... 130,687 128,512 116,336
Eliminations of inter-segment net revenue and other ............. (3,442) (2,479) (1,784)
Total HP consolidated net revenue ........................ $127,245 $126,033 $114,552
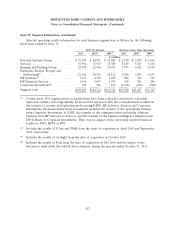
(1) Certain fiscal 2011 organizational reclassifications have been reflected retroactively to provide
improved visibility and comparability. In fiscal 2010 and fiscal 2009, the reclassifications resulted in
the transfer of revenue and operating profit among ESSN, HP Software, Services and Corporate
Investments. Reclassifications between segments included the transfer of the networking business
from Corporate Investments to ESSN, the transfer of the communications and media solutions
business from HP Software to Services, and the transfer of the business intelligence business from
HP Software to Corporate Investments. Revenue was also transferred among the business units
155