HP 2011 Annual Report Download - page 66
Download and view the complete annual report
Please find page 66 of the 2011 HP annual report below. You can navigate through the pages in the report by either clicking on the pages listed below, or by using the keyword search tool below to find specific information within the annual report.-
 1
1 -
2
-
3
-
4
-
5
-
6
-
7
-
8
-
9
-
10
-
11
-
12
-
13
-
14
-
15
-
16
-
17
-
18
-
19
-
20
-
21
-
22
-
23
-
24
-
25
-
26
-
27
-
28
-
29
-
30
-
31
-
32
-
33
-
34
-
35
-
36
-
37
-
38
-
39
-
40
-
41
-
42
-
43
-
44
-
45
-
46
-
47
-
48
-
49
-
50
-
51
-
52
-
53
-
54
-
55
-
 56
56 -
 57
57 -
 58
58 -
 59
59 -
 60
60 -
 61
61 -
 62
62 -
 63
63 -
 64
64 -
 65
65 -
 66
66 -
 67
67 -
 68
68 -
 69
69 -
 70
70 -
 71
71 -
 72
72 -
 73
73 -
 74
74 -
 75
75 -
 76
76 -
77
-
78
-
79
-
80
-
81
-
82
-
83
-
84
-
85
-
86
-
87
-
88
-
89
-
90
-
91
-
92
-
93
-
94
-
95
-
96
-
97
-
98
-
99
-
100
-
101
-
102
-
103
-
104
-
105
-
106
-
107
-
108
-
109
-
110
-
111
-
112
-
113
-
114
-
115
-
116
-
117
-
118
-
119
-
120
-
121
-
122
-
123
-
124
-
125
-
126
-
127
-
128
-
129
-
130
-
131
-
132
-
133
-
134
-
135
-
136
-
137
-
138
-
139
-
140
-
141
-
142
-
143
-
144
-
145
-
146
-
147
-
148
-
149
-
150
-
151
-
152
-
153
-
154
-
155
-
156
-
157
-
158
-
159
-
160
-
161
-
162
-
163
-
164
-
165
-
166
-
167
-
168
-
169
-
170
-
171
-
172
-
173
-
174
-
175
-
176
-
177
-
178
-
179
-
180
-
181
-
182
 |
 |

HEWLETT-PACKARD COMPANY AND SUBSIDIARIES
Management’s Discussion and Analysis of
Financial Condition and Results of Operations (Continued)
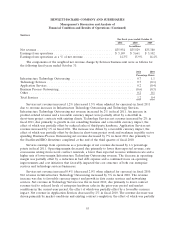
deduplication products. BCS net revenue decreased by 9% in fiscal 2011 mainly as a result of orders
being delayed or cancelled following an announcement by an alliance partner that it intends to cease
software development for our Itanium-based servers. The impact from reduced sales of Itanium-based
servers was partially offset by higher demand for the latest generation of BCS scale-up x86 products
and growth in NonStop servers.
ESSN earnings from operations as a percentage of net revenue decreased by 0.3 percentage points
in fiscal 2011 driven by an increase in operating expenses as a percentage of net revenue, the effect of
which was partially offset by an increase in gross margin. The increase in operating expenses as a
percentage of net revenue was due primarily to additional expenses associated with acquisitions and
investments in R&D and sales coverage. The gross margin increase was driven by lower product costs
and a higher mix of networking products, the effect of which was partially offset by price declines as a
result of competitive pressure.
ESSN net revenue increased 26.3% (23.8% when adjusted for currency) for fiscal 2010. ESSN
blades revenue increased by 37% in fiscal 2010. ISS net revenue increased by 35% in fiscal 2010, driven
primarily by unit volume growth coupled with increased average unit prices due to improving market
conditions and demand for the latest generation of ISS products. Storage net revenue increased by 9%
in fiscal 2010, driven primarily by strong performance in products related to our acquisition of Lefthand
Networks, and growth in high-end disk products and storage networking products. BCS net revenue
decreased 12%, due primarily to market conditions and competitive pressures, the effect of which was
partially offset by new product introductions in the fourth quarter of fiscal 2010. HP Networking net
revenue increased by 124% due to the acquisition of 3Com, improved market demand and continued
investment in sales coverage.
ESSN earnings from operations as a percentage of net revenue increased by 3.6 percentage points
in fiscal 2010, driven by a decrease in operating expenses as a percentage of net revenue and an
increase in gross margin. Operating expenses as a percentage of net revenue decreased as a result of
operating leverage benefits from increased volume and cost controls, partially offset by acquisitions.
The gross margin increase in fiscal 2010 was due primarily to lower product costs and strong volume,
the effect of which was partially offset by a product mix shift resulting from the strength in ISS.
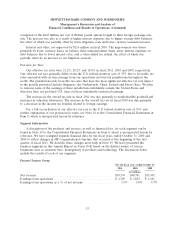
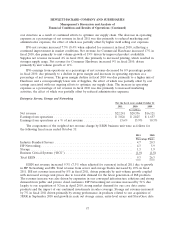
HP Software
For the fiscal years ended October 31
2011 2010 2009
In millions
Net revenue .......................................... $3,217 $2,729 $2,655
Earnings from operations ................................ $ 698 $ 782 $ 731
Earnings from operations as a % of net revenue ................ 21.7% 28.7% 27.5%
HP Software net revenue increased 17.9% (16.3% when adjusted for currency) in fiscal 2011 due
to revenues from acquired companies as well as growth in the organic business. The revenue growth
was driven by good performance from our security and management suite offerings. In fiscal 2011, net
revenue from services, licenses and support increased by 25%, 24% and 11%, respectively.
HP Software earnings from operations as a percentage of net revenue decreased by 7.0 percentage
points in fiscal 2011. The operating margin decline was due primarily to the impact of deferred revenue
write-downs and integration costs associated with acquisitions and investments in sales coverage and
58