HP 2011 Annual Report Download - page 115
Download and view the complete annual report
Please find page 115 of the 2011 HP annual report below. You can navigate through the pages in the report by either clicking on the pages listed below, or by using the keyword search tool below to find specific information within the annual report.-
 1
1 -
2
-
3
-
4
-
5
-
6
-
7
-
8
-
9
-
10
-
11
-
12
-
13
-
14
-
15
-
16
-
17
-
18
-
19
-
20
-
21
-
22
-
23
-
24
-
25
-
26
-
27
-
28
-
29
-
30
-
31
-
32
-
33
-
34
-
35
-
36
-
37
-
38
-
39
-
40
-
41
-
42
-
43
-
44
-
45
-
46
-
47
-
48
-
49
-
50
-
51
-
52
-
53
-
54
-
55
-
56
-
57
-
58
-
59
-
60
-
61
-
62
-
63
-
64
-
65
-
66
-
67
-
68
-
69
-
70
-
71
-
72
-
73
-
74
-
75
-
76
-
77
-
78
-
79
-
80
-
81
-
82
-
83
-
84
-
85
-
86
-
87
-
88
-
89
-
90
-
91
-
92
-
93
-
94
-
95
-
96
-
97
-
98
-
99
-
100
-
101
-
102
-
103
-
104
-
 105
105 -
 106
106 -
 107
107 -
 108
108 -
 109
109 -
 110
110 -
 111
111 -
 112
112 -
 113
113 -
 114
114 -
 115
115 -
 116
116 -
 117
117 -
 118
118 -
 119
119 -
 120
120 -
 121
121 -
 122
122 -
 123
123 -
 124
124 -
 125
125 -
126
-
127
-
128
-
129
-
130
-
131
-
132
-
133
-
134
-
135
-
136
-
137
-
138
-
139
-
140
-
141
-
142
-
143
-
144
-
145
-
146
-
147
-
148
-
149
-
150
-
151
-
152
-
153
-
154
-
155
-
156
-
157
-
158
-
159
-
160
-
161
-
162
-
163
-
164
-
165
-
166
-
167
-
168
-
169
-
170
-
171
-
172
-
173
-
174
-
175
-
176
-
177
-
178
-
179
-
180
-
181
-
182
 |
 |

HEWLETT-PACKARD COMPANY AND SUBSIDIARIES
Notes to Consolidated Financial Statements (Continued)
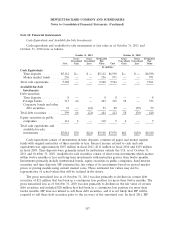
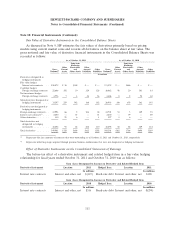
Note 10: Financial Instruments
Cash Equivalents and Available-for-Sale Investments
Cash equivalents and available-for-sale investments at fair value as of October 31, 2011 and
October 31, 2010 were as follows:
October 31, 2011 October 31, 2010
Gross Gross Estimated Gross Gross Estimated
Unrealized Unrealized Fair Unrealized Unrealized Fair
Cost Gain Loss Value Cost Gain Loss Value
In millions
Cash Equivalents
Time deposits .......... $5,112 $— $ — $5,112 $6,590 $— $ — $6,590
Money market funds ..... 236 — — 236 971 — — 971
Total cash equivalents ...... 5,348 — — 5,348 7,561 — — 7,561
Available-for-Sale
Investments
Debt securities:
Time deposits .......... 8 — — 8 8 — — 8
Foreign bonds .......... 317 66 — 383 315 58 — 373
Corporate bonds and other
debt securities ........ 74 — (21) 53 89 — (30) 59
Total debt securities ....... 399 66 (21) 444 412 58 (30) 440
Equity securities in public
companies ............. 114 4 — 118 5 4 — 9
Total cash equivalents and
available-for-sale
investments ............ $5,861 $70 $(21) $5,910 $7,978 $62 $(30) $8,010
Cash equivalents consist of investments in time deposits, commercial paper and money market
funds with original maturities of three months or less. Interest income related to cash and cash
equivalents was approximately $167 million in fiscal 2011, $111 million in fiscal 2010 and $119 million
in fiscal 2009. Time deposits were primarily issued by institutions outside the U.S. as of October 31,
2011 and October 31, 2010. Available-for-sale securities consist of short-term investments which mature
within twelve months or less and long-term investments with maturities greater than twelve months.
Investments primarily include institutional bonds, equity securities in public companies, fixed-interest
securities and time deposits. HP estimates the fair values of its investments based on quoted market
prices or pricing models using current market rates. These estimated fair values may not be
representative of actual values that will be realized in the future.
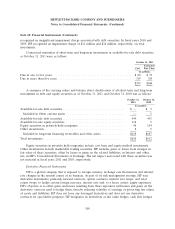
The gross unrealized loss as of October 31, 2011 was due primarily to declines in certain debt
securities of $21 million that has been in a continuous loss position for more than twelve months. The
gross unrealized loss as of October 31, 2010 was due primarily to declines in the fair value of certain
debt securities and included $28 million that had been in a continuous loss position for more than
twelve months. HP does not intend to sell these debt securities, and it is not likely that HP will be
required to sell these debt securities prior to the recovery of the amortized cost. In fiscal 2011, HP
107