HP 2011 Annual Report Download - page 147
Download and view the complete annual report
Please find page 147 of the 2011 HP annual report below. You can navigate through the pages in the report by either clicking on the pages listed below, or by using the keyword search tool below to find specific information within the annual report.-
 1
1 -
2
-
3
-
4
-
5
-
6
-
7
-
8
-
9
-
10
-
11
-
12
-
13
-
14
-
15
-
16
-
17
-
18
-
19
-
20
-
21
-
22
-
23
-
24
-
25
-
26
-
27
-
28
-
29
-
30
-
31
-
32
-
33
-
34
-
35
-
36
-
37
-
38
-
39
-
40
-
41
-
42
-
43
-
44
-
45
-
46
-
47
-
48
-
49
-
50
-
51
-
52
-
53
-
54
-
55
-
56
-
57
-
58
-
59
-
60
-
61
-
62
-
63
-
64
-
65
-
66
-
67
-
68
-
69
-
70
-
71
-
72
-
73
-
74
-
75
-
76
-
77
-
78
-
79
-
80
-
81
-
82
-
83
-
84
-
85
-
86
-
87
-
88
-
89
-
90
-
91
-
92
-
93
-
94
-
95
-
96
-
97
-
98
-
99
-
100
-
101
-
102
-
103
-
104
-
105
-
106
-
107
-
108
-
109
-
110
-
111
-
112
-
113
-
114
-
115
-
116
-
117
-
118
-
119
-
120
-
121
-
122
-
123
-
124
-
125
-
126
-
127
-
128
-
129
-
130
-
131
-
132
-
133
-
134
-
135
-
136
-
 137
137 -
 138
138 -
 139
139 -
 140
140 -
 141
141 -
 142
142 -
 143
143 -
 144
144 -
 145
145 -
 146
146 -
 147
147 -
 148
148 -
 149
149 -
 150
150 -
 151
151 -
 152
152 -
 153
153 -
 154
154 -
 155
155 -
 156
156 -
 157
157 -
158
-
159
-
160
-
161
-
162
-
163
-
164
-
165
-
166
-
167
-
168
-
169
-
170
-
171
-
172
-
173
-
174
-
175
-
176
-
177
-
178
-
179
-
180
-
181
-
182
 |
 |

HEWLETT-PACKARD COMPANY AND SUBSIDIARIES
Notes to Consolidated Financial Statements (Continued)
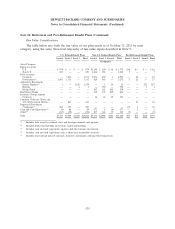
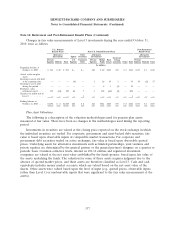
Note 16: Retirement and Post-Retirement Benefit Plans (Continued)
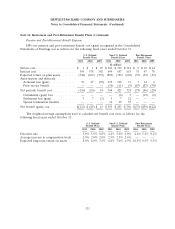
Expected asset class returns reflect the current yield on U.S. government bonds and risk premiums for
each asset class. Because HP’s investment policy is to employ primarily active investment managers who
seek to outperform the broader market, the asset class expected returns are adjusted to reflect the
expected additional returns net of fees.
HP closed the acquisition of EDS on August 26, 2008. Effective immediately before the close of
fiscal 2009, HP merged the assets of the HP and EDS U.S. pension plans. The expected return on the
plan assets, used in calculating the net benefit costs, is 7.6% for fiscal 2012, which reflects the result of
the most recent asset allocation study and is commensurate with the investment strategy for the merged
U.S. pension plan.
The approach used to arrive at the expected rate of return on assets for the non-U.S. plans reflects
the asset allocation policy of each plan and the expected country real returns for equity and fixed
income investments. On an annual basis, HP gathers empirical data from the local country subsidiaries
to determine expected long-term rates of return for equity and fixed income securities. HP then weights
these expected real rates of return based on country specific allocation mixes adjusted for inflation.
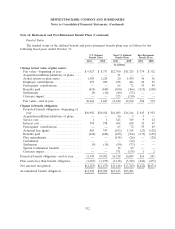
Future Contributions and Funding Policy
In fiscal 2012, HP expects to contribute approximately $597 million to its pension plans and
approximately $31 million to cover benefit payments to U.S. non-qualified plan participants. HP expects
to pay approximately $30 million to cover benefit claims for HP’s post-retirement benefit plans. HP’s
funding policy is to contribute cash to its pension plans so that it meets at least the minimum
contribution requirements, as established by local government, funding and taxing authorities.
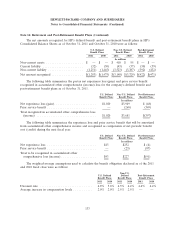
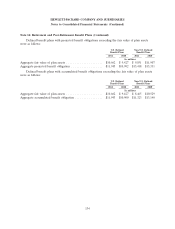
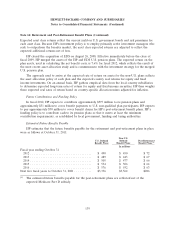
Estimated Future Benefits Payable
HP estimates that the future benefits payable for the retirement and post-retirement plans in place
were as follows at October 31, 2011:
Non-U.S.
U.S. Defined Defined Post-Retirement
Benefit Plans Benefit Plans Benefit Plans(1)
In millions
Fiscal year ending October 31
2012 ................................... $ 490 $ 450 $ 72
2013 ................................... $ 489 $ 443 $ 67
2014 ................................... $ 505 $ 477 $ 66
2015 ................................... $ 534 $ 506 $ 64
2016 ................................... $ 576 $ 552 $ 63
Next five fiscal years to October 31, 2021 .......... $3,336 $3,562 $286
(1) The estimated future benefits payable for the post-retirement plans are reflected net of the
expected Medicare Part D subsidy.
139