HP 2011 Annual Report Download - page 131
Download and view the complete annual report
Please find page 131 of the 2011 HP annual report below. You can navigate through the pages in the report by either clicking on the pages listed below, or by using the keyword search tool below to find specific information within the annual report.-
 1
1 -
2
-
3
-
4
-
5
-
6
-
7
-
8
-
9
-
10
-
11
-
12
-
13
-
14
-
15
-
16
-
17
-
18
-
19
-
20
-
21
-
22
-
23
-
24
-
25
-
26
-
27
-
28
-
29
-
30
-
31
-
32
-
33
-
34
-
35
-
36
-
37
-
38
-
39
-
40
-
41
-
42
-
43
-
44
-
45
-
46
-
47
-
48
-
49
-
50
-
51
-
52
-
53
-
54
-
55
-
56
-
57
-
58
-
59
-
60
-
61
-
62
-
63
-
64
-
65
-
66
-
67
-
68
-
69
-
70
-
71
-
72
-
73
-
74
-
75
-
76
-
77
-
78
-
79
-
80
-
81
-
82
-
83
-
84
-
85
-
86
-
87
-
88
-
89
-
90
-
91
-
92
-
93
-
94
-
95
-
96
-
97
-
98
-
99
-
100
-
101
-
102
-
103
-
104
-
105
-
106
-
107
-
108
-
109
-
110
-
111
-
112
-
113
-
114
-
115
-
116
-
117
-
118
-
119
-
120
-
 121
121 -
 122
122 -
 123
123 -
 124
124 -
 125
125 -
 126
126 -
 127
127 -
 128
128 -
 129
129 -
 130
130 -
 131
131 -
 132
132 -
 133
133 -
 134
134 -
 135
135 -
 136
136 -
 137
137 -
 138
138 -
 139
139 -
 140
140 -
 141
141 -
142
-
143
-
144
-
145
-
146
-
147
-
148
-
149
-
150
-
151
-
152
-
153
-
154
-
155
-
156
-
157
-
158
-
159
-
160
-
161
-
162
-
163
-
164
-
165
-
166
-
167
-
168
-
169
-
170
-
171
-
172
-
173
-
174
-
175
-
176
-
177
-
178
-
179
-
180
-
181
-
182
 |
 |

HEWLETT-PACKARD COMPANY AND SUBSIDIARIES
Notes to Consolidated Financial Statements (Continued)
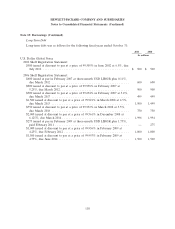
Note 14: Taxes on Earnings (Continued)
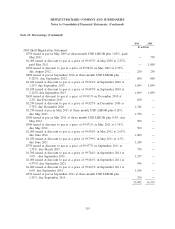
The breakdown between current and long-term deferred tax assets and deferred tax liabilities was
as follows for the following fiscal years ended October 31:
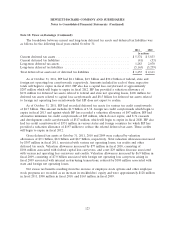
2011 2010
In millions
Current deferred tax assets .......................................... $5,374 $ 5,833
Current deferred tax liabilities ....................................... (41) (53)
Long-term deferred tax assets ........................................ 1,283 2,070
Long-term deferred tax liabilities ..................................... (5,163) (5,239)
Total deferred tax assets net of deferred tax liabilities ...................... $1,453 $ 2,611
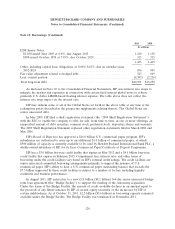
As of October 31, 2011, HP had $2.1 billion, $4.9 billion and $30.2 billion of federal, state and
foreign net operating loss carryforwards, respectively. Amounts included in each of these respective
totals will begin to expire in fiscal 2012. HP also has a capital loss carryforward of approximately
$287 million which will begin to expire in fiscal 2012. HP has provided a valuation allowance of
$132 million for deferred tax assets related to federal and state net operating losses, $106 million for
deferred tax assets related to capital loss carryforwards and $8.5 billion for deferred tax assets related
to foreign net operating loss carryforwards that HP does not expect to realize.
As of October 31, 2011, HP had recorded deferred tax assets for various tax credit carryforwards
of $2.7 billion. This amount includes $1.9 billion of U.S. foreign tax credit carryforwards which begin to
expire in fiscal 2013 and against which HP has recorded a valuation allowance of $47 million. HP had
alternative minimum tax credit carryforwards of $25 million, which do not expire, and U.S. research
and development credit carryforwards of $517 million, which will begin to expire in fiscal 2020. HP also
had tax credit carryforwards of $331 million in various states and foreign countries for which HP has
provided a valuation allowance of $197 million to reduce the related deferred tax asset. These credits
will begin to expire in fiscal 2012.
Gross deferred tax assets at October 31, 2011, 2010 and 2009 were reduced by valuation
allowances of $9.1 billion, $8.8 billion and $8.7 billion, respectively. Total valuation allowances increased
by $307 million in fiscal 2011, associated with various net operating losses, tax credits and other
deferred tax assets. Valuation allowances increased by $77 million in fiscal 2010, consisting of
$106 million associated with federal capital loss carryovers, and a net $29 million decrease associated
with various net operating loss carryovers and credits. Valuation allowances increased by $6.9 billion in
fiscal 2009, consisting of $7.0 billion associated with foreign net operating loss carryovers arising in
fiscal 2009 associated with internal restructuring transactions, reduced by $100 million associated with
state and foreign net operating losses.
Net excess tax benefits resulting from the exercise of employee stock options and other employee
stock programs are recorded as an increase in stockholders’ equity and were approximately $128 million
in fiscal 2011, $300 million in fiscal 2010, and $163 million in fiscal 2009.
123