HP 2011 Annual Report Download - page 61
Download and view the complete annual report
Please find page 61 of the 2011 HP annual report below. You can navigate through the pages in the report by either clicking on the pages listed below, or by using the keyword search tool below to find specific information within the annual report.-
 1
1 -
2
-
3
-
4
-
5
-
6
-
7
-
8
-
9
-
10
-
11
-
12
-
13
-
14
-
15
-
16
-
17
-
18
-
19
-
20
-
21
-
22
-
23
-
24
-
25
-
26
-
27
-
28
-
29
-
30
-
31
-
32
-
33
-
34
-
35
-
36
-
37
-
38
-
39
-
40
-
41
-
42
-
43
-
44
-
45
-
46
-
47
-
48
-
49
-
50
-
 51
51 -
 52
52 -
 53
53 -
 54
54 -
 55
55 -
 56
56 -
 57
57 -
 58
58 -
 59
59 -
 60
60 -
 61
61 -
 62
62 -
 63
63 -
 64
64 -
 65
65 -
 66
66 -
 67
67 -
 68
68 -
 69
69 -
 70
70 -
 71
71 -
72
-
73
-
74
-
75
-
76
-
77
-
78
-
79
-
80
-
81
-
82
-
83
-
84
-
85
-
86
-
87
-
88
-
89
-
90
-
91
-
92
-
93
-
94
-
95
-
96
-
97
-
98
-
99
-
100
-
101
-
102
-
103
-
104
-
105
-
106
-
107
-
108
-
109
-
110
-
111
-
112
-
113
-
114
-
115
-
116
-
117
-
118
-
119
-
120
-
121
-
122
-
123
-
124
-
125
-
126
-
127
-
128
-
129
-
130
-
131
-
132
-
133
-
134
-
135
-
136
-
137
-
138
-
139
-
140
-
141
-
142
-
143
-
144
-
145
-
146
-
147
-
148
-
149
-
150
-
151
-
152
-
153
-
154
-
155
-
156
-
157
-
158
-
159
-
160
-
161
-
162
-
163
-
164
-
165
-
166
-
167
-
168
-
169
-
170
-
171
-
172
-
173
-
174
-
175
-
176
-
177
-
178
-
179
-
180
-
181
-
182
 |
 |

HEWLETT-PACKARD COMPANY AND SUBSIDIARIES
Management’s Discussion and Analysis of
Financial Condition and Results of Operations (Continued)
comprised of the $265 million net cost of British pound options bought to limit foreign exchange rate
risk. The increase was also as a result of higher interest expenses due to higher average debt balances,
the effect of which was partially offset by lower litigation costs and lower currency transaction losses.
Interest and other, net improved by $216 million in fiscal 2010. The improvement was driven
primarily by lower currency losses on balance sheet remeasurement items, lower interest expenses on
debt balances due to lower interest rates, and a value-added tax refund, the effect of which was
partially offset by an increase to our litigation accruals.
Provision for Taxes
Our effective tax rates were 21.2%, 20.2% and 18.6% in fiscal 2011, 2010 and 2009, respectively.
Our effective tax rate generally differs from the U.S. federal statutory rate of 35% due to favorable tax
rates associated with certain earnings from our operations in lower-tax jurisdictions throughout the
world. The jurisdictions with favorable tax rates that have the most significant effective tax rate impact
in the periods presented include Singapore, the Netherlands, China, Ireland and Puerto Rico. We plan
to reinvest some of the earnings of these jurisdictions indefinitely outside the United States and
therefore have not provided U.S. taxes on those indefinitely reinvested earnings.
The increase in the overall tax rate in fiscal 2011 was due primarily to nondeductible goodwill and
increases in valuation allowances. The increase in the overall tax rate in fiscal 2010 was due primarily
to a decrease in the income tax benefits related to foreign earnings.
For a full reconciliation of our effective tax rate to the U.S. federal statutory rate of 35% and
further explanation of our provision for taxes, see Note 14 to the Consolidated Financial Statements in
Item 8, which is incorporated herein by reference.
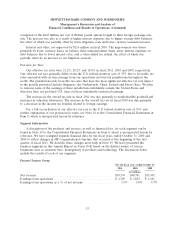
Segment Information
A description of the products and services, as well as financial data, for each segment can be
found in Note 19 to the Consolidated Financial Statements in Item 8, which is incorporated herein by
reference. We have realigned segment financial data for the fiscal years ended October 31, 2010 and
2009 to reflect changes in HP’s organizational structure that occurred at the beginning of the first
quarter of fiscal 2011. We describe these changes more fully in Note 19. We have presented the
business segments in this Annual Report on Form 10-K based on the distinct nature of various
businesses such as customer base, homogeneity of products and technology. The discussions below
include the results of each of our segments.
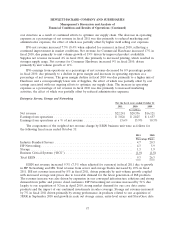
Personal Systems Group
For the fiscal years ended October 31
2011 2010 2009
In millions
Net revenue ........................................... $39,574 $40,741 $35,305
Earnings from operations ................................. $ 2,350 $ 2,032 $ 1,661
Earnings from operations as a % of net revenue ................ 5.9% 5.0% 4.7%
53