HP 2011 Annual Report Download - page 69
Download and view the complete annual report
Please find page 69 of the 2011 HP annual report below. You can navigate through the pages in the report by either clicking on the pages listed below, or by using the keyword search tool below to find specific information within the annual report.-
 1
1 -
2
-
3
-
4
-
5
-
6
-
7
-
8
-
9
-
10
-
11
-
12
-
13
-
14
-
15
-
16
-
17
-
18
-
19
-
20
-
21
-
22
-
23
-
24
-
25
-
26
-
27
-
28
-
29
-
30
-
31
-
32
-
33
-
34
-
35
-
36
-
37
-
38
-
39
-
40
-
41
-
42
-
43
-
44
-
45
-
46
-
47
-
48
-
49
-
50
-
51
-
52
-
53
-
54
-
55
-
56
-
57
-
58
-
 59
59 -
 60
60 -
 61
61 -
 62
62 -
 63
63 -
 64
64 -
 65
65 -
 66
66 -
 67
67 -
 68
68 -
 69
69 -
 70
70 -
 71
71 -
 72
72 -
 73
73 -
 74
74 -
 75
75 -
 76
76 -
 77
77 -
 78
78 -
 79
79 -
80
-
81
-
82
-
83
-
84
-
85
-
86
-
87
-
88
-
89
-
90
-
91
-
92
-
93
-
94
-
95
-
96
-
97
-
98
-
99
-
100
-
101
-
102
-
103
-
104
-
105
-
106
-
107
-
108
-
109
-
110
-
111
-
112
-
113
-
114
-
115
-
116
-
117
-
118
-
119
-
120
-
121
-
122
-
123
-
124
-
125
-
126
-
127
-
128
-
129
-
130
-
131
-
132
-
133
-
134
-
135
-
136
-
137
-
138
-
139
-
140
-
141
-
142
-
143
-
144
-
145
-
146
-
147
-
148
-
149
-
150
-
151
-
152
-
153
-
154
-
155
-
156
-
157
-
158
-
159
-
160
-
161
-
162
-
163
-
164
-
165
-
166
-
167
-
168
-
169
-
170
-
171
-
172
-
173
-
174
-
175
-
176
-
177
-
178
-
179
-
180
-
181
-
182
 |
 |

HEWLETT-PACKARD COMPANY AND SUBSIDIARIES
Management’s Discussion and Analysis of
Financial Condition and Results of Operations (Continued)
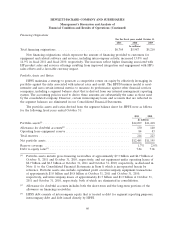
Net portfolio assets at October 31, 2011 increased 11.5% from October 31, 2010. The increase
resulted from higher levels of financing originations in fiscal 2011 and a favorable currency impact. The
overall reserve coverage ratio decreased as a percentage of the portfolio assets. HPFS funds its
operations mainly through a combination of intercompany debt and equity.
HPFS recorded net bad debt expenses of $60 million and $75 million in fiscal 2011 and fiscal 2010,
respectively.
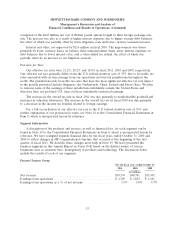
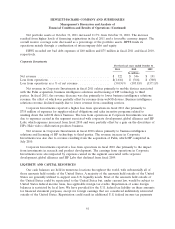
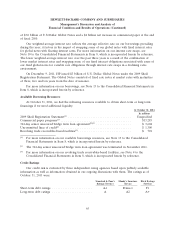
Corporate Investments
For the fiscal years ended October 31
2011 2010 2009
In millions
Net revenue ......................................... $ 322 $ 346 $ 191
Loss from operations ................................... $(1,616) $ (366) $ (300)
Loss from operations as a % of net revenue .................. (501.9)% (105.8)% (157.1)%
Net revenue in Corporate Investments in fiscal 2011 relates primarily to mobile devices associated
with the Palm acquisition, business intelligence solutions and licensing of HP technology to third
parties. In fiscal 2011, the revenue decrease was due primarily to lower business intelligence solutions
revenue, the effect of which was partially offset by revenue from webOS devices. Business intelligence
solutions revenue declined mainly due to lower revenue from consulting services.
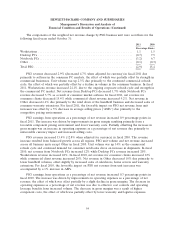
Corporate Investments reported a higher loss from operations in fiscal 2011 due primarily to
$755 million of expenses for supplier-related obligations and sales incentive programs related to
winding down the webOS device business. The loss from operations in Corporate Investments was also
due to expenses carried in the segment associated with corporate development, global alliances and HP
Labs, which expenses increased from fiscal 2010 and were partially offset by a gain on the divestiture of
HP’s Halo video collaboration products business.
Net revenue in Corporate Investments in fiscal 2010 relates primarily to business intelligence
solutions and licensing of HP technology to third parties. The revenue increase in Corporate
Investments was also due to revenue resulting from the acquisition of Palm, which HP completed in
July 2010.
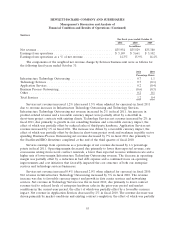
Corporate Investments reported a loss from operations in fiscal 2010 due primarily to the impact
from investments in research and product development. The earnings from operations in Corporate
Investments were also impacted by expenses carried in the segment associated with corporate
development, global alliances and HP Labs that declined from fiscal 2009.
LIQUIDITY AND CAPITAL RESOURCES
Our cash balances are held in numerous locations throughout the world, with substantially all of
those amounts held outside of the United States. A majority of the amounts held outside of the United
States are generally utilized to support non-U.S. liquidity needs. Most of the amounts held outside of
the United States could be repatriated to the United States but, under current law, would be subject to
United States federal income taxes, less applicable foreign tax credits. Repatriation of some foreign
balances is restricted by local laws. We have provided for the U.S. federal tax liability on these amounts
for financial statement purposes, except for foreign earnings that are considered indefinitely reinvested
outside of the United States. Repatriation could result in additional U.S. federal income tax payments
61