HP 2011 Annual Report Download - page 114
Download and view the complete annual report
Please find page 114 of the 2011 HP annual report below. You can navigate through the pages in the report by either clicking on the pages listed below, or by using the keyword search tool below to find specific information within the annual report.-
 1
1 -
2
-
3
-
4
-
5
-
6
-
7
-
8
-
9
-
10
-
11
-
12
-
13
-
14
-
15
-
16
-
17
-
18
-
19
-
20
-
21
-
22
-
23
-
24
-
25
-
26
-
27
-
28
-
29
-
30
-
31
-
32
-
33
-
34
-
35
-
36
-
37
-
38
-
39
-
40
-
41
-
42
-
43
-
44
-
45
-
46
-
47
-
48
-
49
-
50
-
51
-
52
-
53
-
54
-
55
-
56
-
57
-
58
-
59
-
60
-
61
-
62
-
63
-
64
-
65
-
66
-
67
-
68
-
69
-
70
-
71
-
72
-
73
-
74
-
75
-
76
-
77
-
78
-
79
-
80
-
81
-
82
-
83
-
84
-
85
-
86
-
87
-
88
-
89
-
90
-
91
-
92
-
93
-
94
-
95
-
96
-
97
-
98
-
99
-
100
-
101
-
102
-
103
-
 104
104 -
 105
105 -
 106
106 -
 107
107 -
 108
108 -
 109
109 -
 110
110 -
 111
111 -
 112
112 -
 113
113 -
 114
114 -
 115
115 -
 116
116 -
 117
117 -
 118
118 -
 119
119 -
 120
120 -
 121
121 -
 122
122 -
 123
123 -
 124
124 -
125
-
126
-
127
-
128
-
129
-
130
-
131
-
132
-
133
-
134
-
135
-
136
-
137
-
138
-
139
-
140
-
141
-
142
-
143
-
144
-
145
-
146
-
147
-
148
-
149
-
150
-
151
-
152
-
153
-
154
-
155
-
156
-
157
-
158
-
159
-
160
-
161
-
162
-
163
-
164
-
165
-
166
-
167
-
168
-
169
-
170
-
171
-
172
-
173
-
174
-
175
-
176
-
177
-
178
-
179
-
180
-
181
-
182
 |
 |

HEWLETT-PACKARD COMPANY AND SUBSIDIARIES
Notes to Consolidated Financial Statements (Continued)
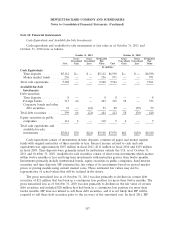
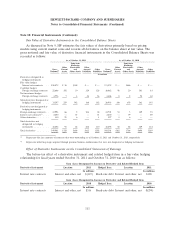
Note 9: Fair Value (Continued)
The following table presents HP’s assets and liabilities that are measured at fair value on a
recurring basis:
As of October 31, 2011 As of October 31, 2010
Fair Value Fair Value
Measured Using Measured Using
Total Total
Level 1 Level 2 Level 3 Balance Level 1 Level 2 Level 3 Balance
In millions
Assets
Time deposits ................... $— $5,120 $— $5,120 $ — $6,598 $— $6,598
Money market funds ............... 236 — — 236 971 — — 971
Marketable equity securities .......... 120 2 — 122 11 3 — 14
Foreign bonds ................... 7 376 — 383 8 365 — 373
Corporate bonds and other debt securities . 3 2 48 53 3 6 50 59
Derivatives:
Interest rate contracts ............. — 593 — 593 — 735 — 735
Foreign exchange contracts ......... — 269 35 304 — 150 32 182
Other derivatives ................ — 25 6 31 — 5 6 11
Total Assets ................. $366 $6,387 $89 $6,842 $993 $7,862 $88 $8,943
Liabilities
Derivatives:
Interest rate contracts ............. $— $ 71 $— $ 71 $— $ 89 $— $ 89
Foreign exchange contracts ......... — 823 9 832 — 880 10 890
Other derivatives ................ — 1 — 1 — — — —
Total Liabilities ............... $— $ 895 $9 $ 904 $— $ 969 $10 $ 979
106