HP 2011 Annual Report Download - page 165
Download and view the complete annual report
Please find page 165 of the 2011 HP annual report below. You can navigate through the pages in the report by either clicking on the pages listed below, or by using the keyword search tool below to find specific information within the annual report.-
 1
1 -
2
-
3
-
4
-
5
-
6
-
7
-
8
-
9
-
10
-
11
-
12
-
13
-
14
-
15
-
16
-
17
-
18
-
19
-
20
-
21
-
22
-
23
-
24
-
25
-
26
-
27
-
28
-
29
-
30
-
31
-
32
-
33
-
34
-
35
-
36
-
37
-
38
-
39
-
40
-
41
-
42
-
43
-
44
-
45
-
46
-
47
-
48
-
49
-
50
-
51
-
52
-
53
-
54
-
55
-
56
-
57
-
58
-
59
-
60
-
61
-
62
-
63
-
64
-
65
-
66
-
67
-
68
-
69
-
70
-
71
-
72
-
73
-
74
-
75
-
76
-
77
-
78
-
79
-
80
-
81
-
82
-
83
-
84
-
85
-
86
-
87
-
88
-
89
-
90
-
91
-
92
-
93
-
94
-
95
-
96
-
97
-
98
-
99
-
100
-
101
-
102
-
103
-
104
-
105
-
106
-
107
-
108
-
109
-
110
-
111
-
112
-
113
-
114
-
115
-
116
-
117
-
118
-
119
-
120
-
121
-
122
-
123
-
124
-
125
-
126
-
127
-
128
-
129
-
130
-
131
-
132
-
133
-
134
-
135
-
136
-
137
-
138
-
139
-
140
-
141
-
142
-
143
-
144
-
145
-
146
-
147
-
148
-
149
-
150
-
151
-
152
-
153
-
154
-
 155
155 -
 156
156 -
 157
157 -
 158
158 -
 159
159 -
 160
160 -
 161
161 -
 162
162 -
 163
163 -
 164
164 -
 165
165 -
 166
166 -
 167
167 -
 168
168 -
 169
169 -
 170
170 -
 171
171 -
 172
172 -
 173
173 -
 174
174 -
 175
175 -
176
-
177
-
178
-
179
-
180
-
181
-
182
 |
 |

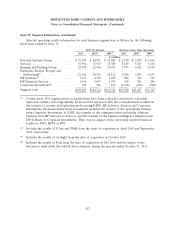
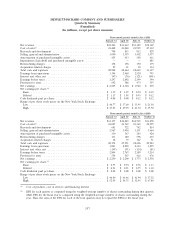
HEWLETT-PACKARD COMPANY AND SUBSIDIARIES
Quarterly Summary
(Unaudited)
(In millions, except per share amounts)
Three-month periods ended in fiscal 2011
January 31 April 30 July 31 October 31
Net revenue ........................................ $32,302 $31,632 $31,189 $32,122
Cost of sales(1) ....................................... 24,408 23,860 23,929 25,332
Research and development .............................. 798 815 812 829
Selling, general and administrative ......................... 3,090 3,397 3,402 3,577
Amortization of purchased intangible assets ................... 425 413 358 411
Impairment of goodwill and purchased intangible assets ........... — — — 885
Restructuring charges .................................. 158 158 150 179
Acquisition-related charges .............................. 29 21 18 114
Total costs and expenses ................................ 28,908 28,664 28,669 31,327
Earnings from operations ............................... 3,394 2,968 2,520 795
Interest and other, net ................................. (97) (76) (121) (401)
Earnings before taxes .................................. 3,297 2,892 2,399 394
Provision for taxes .................................... 692 588 473 155
Net earnings ........................................ $2,605 $ 2,304 $ 1,926 $ 239
Net earnings per share:(2)
Basic ............................................ $ 1.19 $ 1.07 $ 0.94 $ 0.12
Diluted .......................................... $ 1.17 $ 1.05 $ 0.93 $ 0.12
Cash dividends paid per share ............................ $ 0.08 $ 0.08 $ 0.12 $ 0.12
Range of per share stock prices on the New York Stock Exchange
Low ............................................ $40.77 $ 37.60 $ 33.95 $ 21.50
High ............................................ $47.83 $ 49.39 $ 41.74 $ 35.50
Three-month periods ended in fiscal 2010
January 31 April 30 July 31 October 31
Net revenue ........................................ $31,177 $30,849 $30,729 $33,278
Cost of sales(1) ....................................... 24,027 23,569 23,365 24,995
Research and development .............................. 681 722 742 814
Selling, general and administrative ......................... 2,967 3,096 3,191 3,464
Amortization of purchased intangible assets ................... 330 347 383 424
Restructuring charges .................................. 131 180 598 235
Acquisition-related charges .............................. 38 77 127 51
Total costs and expenses ................................ 28,174 27,991 28,406 29,983
Earnings from operations ............................... 3,003 2,858 2,323 3,295
Interest and other, net ................................. (199) (91) (134) (81)
Earnings before taxes .................................. 2,804 2,767 2,189 3,214
Provision for taxes .................................... 554 567 416 676
Net earnings ........................................ $2,250 $ 2,200 $ 1,773 $ 2,538
Net earnings per share:(2)
Basic ............................................ $ 0.95 $ 0.94 $ 0.76 $ 1.13
Diluted .......................................... $ 0.93 $ 0.91 $ 0.75 $ 1.10
Cash dividends paid per share ............................ $ 0.08 $ 0.08 $ 0.08 $ 0.08
Range of per share stock prices on the New York Stock Exchange
Low ............................................ $46.80 $ 46.46 $ 41.94 $ 37.32
High ............................................ $52.95 $ 54.75 $ 52.95 $ 47.80
(1) Cost of products, cost of services and financing interest.
(2) EPS for each quarter is computed using the weighted-average number of shares outstanding during that quarter,
while EPS for the fiscal year is computed using the weighted-average number of shares outstanding during the
year. Thus, the sum of the EPS for each of the four quarters may not equal the EPS for the fiscal year.
157