HP 2011 Annual Report Download - page 62
Download and view the complete annual report
Please find page 62 of the 2011 HP annual report below. You can navigate through the pages in the report by either clicking on the pages listed below, or by using the keyword search tool below to find specific information within the annual report.-
 1
1 -
2
-
3
-
4
-
5
-
6
-
7
-
8
-
9
-
10
-
11
-
12
-
13
-
14
-
15
-
16
-
17
-
18
-
19
-
20
-
21
-
22
-
23
-
24
-
25
-
26
-
27
-
28
-
29
-
30
-
31
-
32
-
33
-
34
-
35
-
36
-
37
-
38
-
39
-
40
-
41
-
42
-
43
-
44
-
45
-
46
-
47
-
48
-
49
-
50
-
51
-
 52
52 -
 53
53 -
 54
54 -
 55
55 -
 56
56 -
 57
57 -
 58
58 -
 59
59 -
 60
60 -
 61
61 -
 62
62 -
 63
63 -
 64
64 -
 65
65 -
 66
66 -
 67
67 -
 68
68 -
 69
69 -
 70
70 -
 71
71 -
 72
72 -
73
-
74
-
75
-
76
-
77
-
78
-
79
-
80
-
81
-
82
-
83
-
84
-
85
-
86
-
87
-
88
-
89
-
90
-
91
-
92
-
93
-
94
-
95
-
96
-
97
-
98
-
99
-
100
-
101
-
102
-
103
-
104
-
105
-
106
-
107
-
108
-
109
-
110
-
111
-
112
-
113
-
114
-
115
-
116
-
117
-
118
-
119
-
120
-
121
-
122
-
123
-
124
-
125
-
126
-
127
-
128
-
129
-
130
-
131
-
132
-
133
-
134
-
135
-
136
-
137
-
138
-
139
-
140
-
141
-
142
-
143
-
144
-
145
-
146
-
147
-
148
-
149
-
150
-
151
-
152
-
153
-
154
-
155
-
156
-
157
-
158
-
159
-
160
-
161
-
162
-
163
-
164
-
165
-
166
-
167
-
168
-
169
-
170
-
171
-
172
-
173
-
174
-
175
-
176
-
177
-
178
-
179
-
180
-
181
-
182
 |
 |

HEWLETT-PACKARD COMPANY AND SUBSIDIARIES
Management’s Discussion and Analysis of
Financial Condition and Results of Operations (Continued)
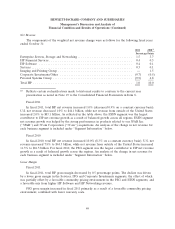
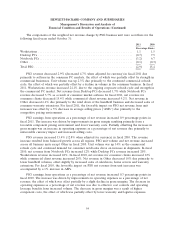
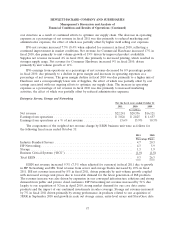
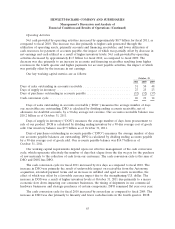
The components of the weighted net revenue change by PSG business unit were as follows for the
following fiscal years ended October 31:
2011 2010
Percentage Points
Workstations ...................................................... 1.1 1.5
Desktop PCs ...................................................... (0.7) 7.5
Notebook PCs ..................................................... (3.2) 6.7
Other ........................................................... (0.1) (0.3)
Total PSG ........................................................ (2.9) 15.4
PSG revenue decreased 2.9% (decreased 4.7% when adjusted for currency) in fiscal 2011 due
primarily to softness in the consumer PC markets, the effect of which was partially offset by strength in
commercial businesses. Unit volume was up 2.3% due primarily to the continued commercial refresh
cycle, the effect of which was partially offset by a decline in volume in the consumer business. In fiscal
2011, Workstations revenue increased 24.1% due to the ongoing corporate refresh cycle and strength in
the commercial PC market. Net revenue from Desktop PCs decreased 1.7% while Notebook PCs
revenue decreased 5.7% as a result of consumer market softness. In fiscal 2011, net revenue for
consumer clients decreased 15.4% while commercial client revenue increased 9.2%. Net revenue in
Other decreased 6.6% due primarily to the wind down of the handheld business and decreased sales of
consumer warranty extensions. For fiscal 2011, the favorable impact on PSG net revenue from unit
increases was offset by a 5% decrease in average selling prices (‘‘ASPs’’) due primarily to the
competitive pricing environment.
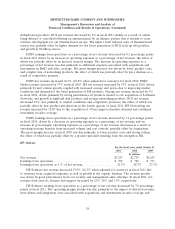
PSG earnings from operations as a percentage of net revenue increased 0.9 percentage points in
fiscal 2011. The increase was driven by improvements in gross margin resulting primarily from a
favorable component pricing environment and lower warranty costs. Partially offsetting the increase in
gross margin was an increase in operating expenses as a percentage of net revenue due primarily to
unfavorable currency impact and increased selling costs.
PSG revenue increased 15.4% (12.8% when adjusted for currency) in fiscal 2010. The revenue
increase resulted from balanced growth across all regions. PSG unit volume and net revenue increased
across all business units except Other in fiscal 2010. Unit volume was up 14% as the commercial
refresh cycle and continued demand for consumer notebooks drove an increase in shipments. In fiscal
2010, net revenue from Notebook PCs increased 12% while Desktop PCs revenue increased 20%.
Workstations revenue increased 42%. In fiscal 2010, net revenue for consumer clients increased 12%
while commercial client revenue increased 20%. Net revenue in Other decreased 10% due primarily to
lower handheld volumes, offset slightly by increased sales of calculators, home servers and warranty
extensions. For fiscal 2010, the favorable impact on PSG net revenue from unit increases was
accompanied by a 1% increase in ASPs.
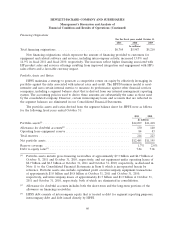
PSG earnings from operations as a percentage of net revenue increased 0.3 percentage points in
fiscal 2010. The increase was driven by improvements in operating expenses as a percentage of net
revenue, the effect of which was offset partially by a slight decline in gross margins. The decrease in
operating expenses as a percentage of net revenue was due to effective cost controls and operating
leverage benefits from increased volume. The decrease in gross margins was a result of higher
component costs, the effect of which was partially offset by lower warranty and logistics expenses.
54