HP 2011 Annual Report Download - page 70
Download and view the complete annual report
Please find page 70 of the 2011 HP annual report below. You can navigate through the pages in the report by either clicking on the pages listed below, or by using the keyword search tool below to find specific information within the annual report.-
 1
1 -
2
-
3
-
4
-
5
-
6
-
7
-
8
-
9
-
10
-
11
-
12
-
13
-
14
-
15
-
16
-
17
-
18
-
19
-
20
-
21
-
22
-
23
-
24
-
25
-
26
-
27
-
28
-
29
-
30
-
31
-
32
-
33
-
34
-
35
-
36
-
37
-
38
-
39
-
40
-
41
-
42
-
43
-
44
-
45
-
46
-
47
-
48
-
49
-
50
-
51
-
52
-
53
-
54
-
55
-
56
-
57
-
58
-
59
-
 60
60 -
 61
61 -
 62
62 -
 63
63 -
 64
64 -
 65
65 -
 66
66 -
 67
67 -
 68
68 -
 69
69 -
 70
70 -
 71
71 -
 72
72 -
 73
73 -
 74
74 -
 75
75 -
 76
76 -
 77
77 -
 78
78 -
 79
79 -
 80
80 -
81
-
82
-
83
-
84
-
85
-
86
-
87
-
88
-
89
-
90
-
91
-
92
-
93
-
94
-
95
-
96
-
97
-
98
-
99
-
100
-
101
-
102
-
103
-
104
-
105
-
106
-
107
-
108
-
109
-
110
-
111
-
112
-
113
-
114
-
115
-
116
-
117
-
118
-
119
-
120
-
121
-
122
-
123
-
124
-
125
-
126
-
127
-
128
-
129
-
130
-
131
-
132
-
133
-
134
-
135
-
136
-
137
-
138
-
139
-
140
-
141
-
142
-
143
-
144
-
145
-
146
-
147
-
148
-
149
-
150
-
151
-
152
-
153
-
154
-
155
-
156
-
157
-
158
-
159
-
160
-
161
-
162
-
163
-
164
-
165
-
166
-
167
-
168
-
169
-
170
-
171
-
172
-
173
-
174
-
175
-
176
-
177
-
178
-
179
-
180
-
181
-
182
 |
 |

HEWLETT-PACKARD COMPANY AND SUBSIDIARIES
Management’s Discussion and Analysis of
Financial Condition and Results of Operations (Continued)
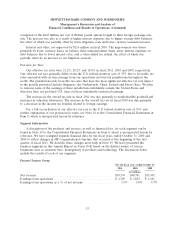
in future years. Where local restrictions prevent an efficient intercompany transfer of funds, our intent
is that cash balances would remain outside of the United States and we would meet U.S. liquidity
needs through ongoing cash flows, external borrowings, or both. We utilize a variety of tax planning
and financing strategies in an effort to ensure that our worldwide cash is available in the locations in
which it is needed. We do not expect restrictions or potential taxes on repatriation of amounts held
outside of the United States to have a material effect on HP’s overall liquidity, financial condition or
results of operations.
LIQUIDITY
We use cash generated by operations as our primary source of liquidity; we believe that internally
generated cash flows are generally sufficient to support business operations, capital expenditures and
the payment of stockholder dividends, in addition to discretionary investments and share repurchases.
We are able to supplement this near-term liquidity, if necessary, with broad access to capital markets
and credit line facilities made available by various foreign and domestic financial institutions. Our
liquidity is subject to various risks including the market risks identified in the section entitled
‘‘Qualitative and Quantitative Disclosures about Market Risk’’ in Item 7A.
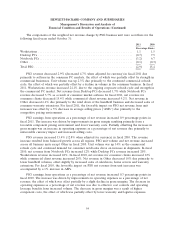
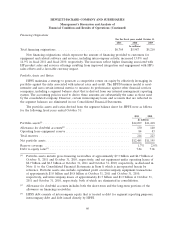
For the fiscal years ended October 31
2011 2010 2009
In billions
Cash and cash equivalents ................................ $ 8.0 $10.9 $13.3
Total debt ............................................ $30.6 $22.3 $15.8
Available borrowing resources(1)(2) ........................... $14.6 $13.8 $18.1
(1) In addition to these available borrowing resources, we are able to offer for sale, from time to time,
in one or more offerings, an unspecified amount of debt securities, common stock, preferred stock,
depositary shares and warrants under a shelf registration statement filed with the SEC in May 2009
(the ‘‘2009 Shelf Registration Statement’’).
(2) Available borrowing resources does not include £2.2 billion ($3.6 billion) in borrowing resources
under our 364-day senior unsecured bridge term loan agreement that was entered into in August
2011 and terminated in November 2011.
Our cash position remains strong, and we believe our cash balances and anticipated cash flow
generated from operations are sufficient to cover cash outlays expected in fiscal 2012.
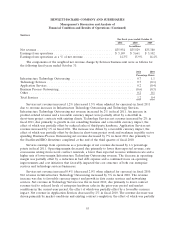
Cash Flows
The following table summarizes the key cash flow metrics from our consolidated statements of
cash flow:
For the fiscal years ended October 31
2011 2010 2009
In millions
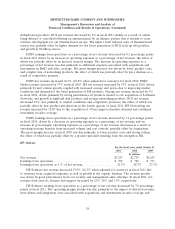
Net cash provided by operating activities ..................... $12,639 $ 11,922 $13,379
Net cash used in investing activities ........................ (13,959) (11,359) (3,580)
Net cash used in financing activities ........................ (1,566) (2,913) (6,673)
Net (decrease) increase in cash and cash equivalents ............ $ (2,886) $ (2,350) $ 3,126
62