HP 2011 Annual Report Download - page 143
Download and view the complete annual report
Please find page 143 of the 2011 HP annual report below. You can navigate through the pages in the report by either clicking on the pages listed below, or by using the keyword search tool below to find specific information within the annual report.-
 1
1 -
2
-
3
-
4
-
5
-
6
-
7
-
8
-
9
-
10
-
11
-
12
-
13
-
14
-
15
-
16
-
17
-
18
-
19
-
20
-
21
-
22
-
23
-
24
-
25
-
26
-
27
-
28
-
29
-
30
-
31
-
32
-
33
-
34
-
35
-
36
-
37
-
38
-
39
-
40
-
41
-
42
-
43
-
44
-
45
-
46
-
47
-
48
-
49
-
50
-
51
-
52
-
53
-
54
-
55
-
56
-
57
-
58
-
59
-
60
-
61
-
62
-
63
-
64
-
65
-
66
-
67
-
68
-
69
-
70
-
71
-
72
-
73
-
74
-
75
-
76
-
77
-
78
-
79
-
80
-
81
-
82
-
83
-
84
-
85
-
86
-
87
-
88
-
89
-
90
-
91
-
92
-
93
-
94
-
95
-
96
-
97
-
98
-
99
-
100
-
101
-
102
-
103
-
104
-
105
-
106
-
107
-
108
-
109
-
110
-
111
-
112
-
113
-
114
-
115
-
116
-
117
-
118
-
119
-
120
-
121
-
122
-
123
-
124
-
125
-
126
-
127
-
128
-
129
-
130
-
131
-
132
-
 133
133 -
 134
134 -
 135
135 -
 136
136 -
 137
137 -
 138
138 -
 139
139 -
 140
140 -
 141
141 -
 142
142 -
 143
143 -
 144
144 -
 145
145 -
 146
146 -
 147
147 -
 148
148 -
 149
149 -
 150
150 -
 151
151 -
 152
152 -
 153
153 -
154
-
155
-
156
-
157
-
158
-
159
-
160
-
161
-
162
-
163
-
164
-
165
-
166
-
167
-
168
-
169
-
170
-
171
-
172
-
173
-
174
-
175
-
176
-
177
-
178
-
179
-
180
-
181
-
182
 |
 |

HEWLETT-PACKARD COMPANY AND SUBSIDIARIES
Notes to Consolidated Financial Statements (Continued)
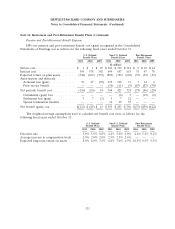
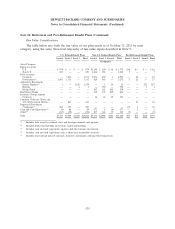
Note 16: Retirement and Post-Retirement Benefit Plans (Continued)
Fair Value Considerations
The table below sets forth the fair value of our plan assets as of October 31, 2011 by asset
category, using the same three-level hierarchy of fair-value inputs described in Note 9.
U.S. Defined Benefit Plans Non-U.S. Defined Benefit Plans Post-Retirement Benefit Plans
Level 1 Level 2 Level 3 Total Level 1 Level 2 Level 3 Total Level 1 Level 2 Level 3 Total
In millions
Asset Category:
Equity securities
U.S. ................. $ 974 $ — $ — $ 974 $1,140 $ 200 $ 30 $ 1,370 $16 $— $ — $ 16
Non-U.S. .............. 850 — — 850 4,066 354 — 4,420 7 — — 7
Debt securities
Corporate .............. — 3,031 — 3,031 2,254 694 3 2,951 — 22 — 22
Government(1) ........... 1,801 1,331 — 3,132 810 465 — 1,275 5 22 — 27
Alternative Investments
Private Equities(2) ......... 3 — 1,356 1,359 — 1 20 21 — — 227 227
Hybrids ............... — — 4 4 — 790 — 790 — — 1 1
Hedge Funds ............ — — — — 107 152 300 559 — — — —
Real Estate Funds .......... — — — — 349 138 199 686 — — — —
Insurance Group Annuity
Contracts .............. — — — — 16 46 89 151 — — — —
Common Collective Trusts and
103-12 Investment Entities .... — 843 — 843 — — — — — 21 — 21
Registered Investment
Companies(3) ............ 206 375 — 581 — — — — 69 7 — 76
Cash and Cash Equivalents(4) .... (4) 68 — 64 573 8 (4) 577 — 2 — 2
Other(5) ................. (117) (59) — (176) 217 144 19 380 (5) — — (5)
Total ................... $3,713 $5,589 $1,360 $10,662 $9,532 $2,992 $656 $13,180 $92 $74 $228 $394
(1) Includes debt issued by national, state and local governments and agencies.
(2) Includes limited partnerships and venture capital partnerships.
(3) Includes cash and cash equivalents, equities, and fixed income investments.
(4) Includes cash and cash equivalents such as short-term marketable securities.
(5) Includes international insured contracts, derivative instruments and unsettled transactions.
135