GNC 2008 Annual Report Download - page 90
Download and view the complete annual report
Please find page 90 of the 2008 GNC annual report below. You can navigate through the pages in the report by either clicking on the pages listed below, or by using the keyword search tool below to find specific information within the annual report.-
 1
1 -
2
-
3
-
4
-
5
-
6
-
7
-
8
-
9
-
10
-
11
-
12
-
13
-
14
-
15
-
16
-
17
-
18
-
19
-
20
-
21
-
22
-
23
-
24
-
25
-
26
-
27
-
28
-
29
-
30
-
31
-
32
-
33
-
34
-
35
-
36
-
37
-
38
-
39
-
40
-
41
-
42
-
43
-
44
-
45
-
46
-
47
-
48
-
49
-
50
-
51
-
52
-
53
-
54
-
55
-
56
-
57
-
58
-
59
-
60
-
61
-
62
-
63
-
64
-
65
-
66
-
67
-
68
-
69
-
70
-
71
-
72
-
73
-
74
-
75
-
76
-
77
-
78
-
79
-
 80
80 -
 81
81 -
 82
82 -
 83
83 -
 84
84 -
 85
85 -
 86
86 -
 87
87 -
 88
88 -
 89
89 -
 90
90 -
 91
91 -
 92
92 -
 93
93 -
 94
94 -
 95
95 -
 96
96 -
 97
97 -
 98
98 -
 99
99 -
 100
100 -
101
-
102
-
103
-
104
-
105
-
106
-
107
-
108
-
109
-
110
-
111
-
112
-
113
-
114
-
115
-
116
-
117
-
118
-
119
-
120
-
121
-
122
-
123
-
124
-
125
-
126
-
127
-
128
-
129
-
130
-
131
-
132
-
133
-
134
-
135
-
136
-
137
-
138
-
139
-
140
-
141
-
142
-
143
-
144
-
145
-
146
-
147
-
148
-
149
-
150
-
151
-
152
-
153
-
154
-
155
-
156
-
157
-
158
-
159
-
160
-
161
-
162
-
163
-
164
-
165
-
166
-
167
-
168
-
169
-
170
-
171
-
172
-
173
-
174
-
175
-
176
-
177
-
178
-
179
-
180
-
181
-
182
-
183
-
184
-
185
-
186
-
187
-
188
-
189
-
190
-
191
-
192
-
193
-
194
-
195
-
196
-
197
-
198
-
199
-
200
-
201
-
202
-
203
-
204
-
205
-
206
-
207
-
208
-
209
-
210
-
211
-
212
-
213
-
214
-
215
-
216
-
217
-
218
-
219
-
220
-
221
-
222
-
223
-
224
-
225
-
226
-
227
-
228
-
229
-
230
-
231
-
232
-
233
-
234
-
235
-
236
-
237
-
238
-
239
-
240
-
241
-
242
-
243
-
244
-
245
-
246
-
247
-
248
-
249
-
250
-
251
-
252
-
253
-
254
-
255
-
256
-
257
-
258
-
259
-
260
-
261
-
262
-
263
-
264
-
265
-
266
-
267
-
268
-
269
-
270
-
271
-
272
-
273
-
274
-
275
-
276
-
277
-
278
-
279
-
280
-
281
-
282
 |
 |
Table of Contents
GENERAL NUTRITION CENTERS, INC. AND SUBSIDIARIES
NOTES TO CONSOLIDATED FINANCIAL STATEMENTS
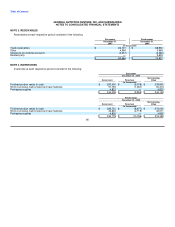
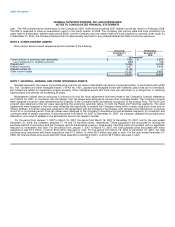
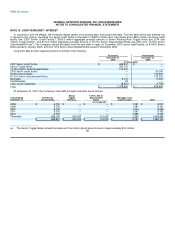
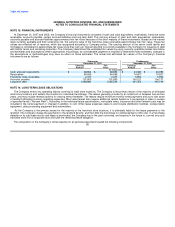
Intangible assets other than goodwill consisted of the following at each respective period.
Retail Franchise Operating Franchise
Gold Card Brand Brand Agreements Rights Total
(in thousands)
Predecessor
Balance at December 31, 2005 $ 514 $ 59,659 $ 152,341 $ 24,296 $ 1,650 $ 238,460
Acquired franchise stores — — — — 1,197 1,197
Reclassification: Due to franchise store acquisition — 7,817 (7,817) — — —
Amortization expense (514) — — (2,944) (1,137) (4,595)
Balance at December 31, 2006 $ — $ 67,476 $ 144,524 $ 21,352 $ 1,710 $ 235,062
Acquired franchise stores — — — — 207 207
Amortization expense — — — (609) (256) (865)
Balance at March 15, 2007 $ — $ 67,476 $ 144,524 $ 20,743 $ 1,661 $ 234,404
Successor
Balance at March 16, 2007 $ 3,300 $ 500,000 $ 220,000 $ 178,000 $ 1,661 $ 902,961
Purchase accounting adjustments 5,700 — — (7,000) — (1,300)
Acquired franchise stores — — — — 252 252
Other additions — — — 150 — 150
Amortization expense (2,959) — — (5,448) (784) (9,191)
Balance at December 31, 2007 $ 6,041 $ 500,000 $ 220,000 $ 165,702 $ 1,129 $ 892,872
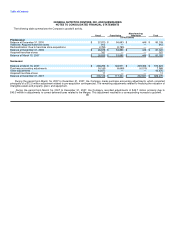
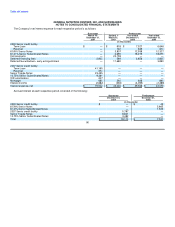
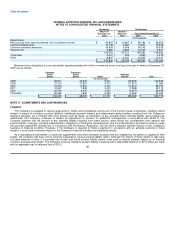
The following table represents the gross carrying amount and accumulated amortization for each major intangible asset:
Successor Predecessor
Estimated December 31, 2007 December 31, 2006
Life Accumulated Carrying Accumulated Carrying
in years Cost Amortization Amount Cost Amortization Amount
(in thousands)
Brands — retail — $ 500,000 $ — $ 500,000 $ 67,476 $ — $ 67,476
Brands — franchise — 220,000 — 220,000 144,524 — 144,524
Gold card — retail 3 3,500 (1,155) 2,345 2,230 (2,230) —
Gold card — franchise 3 5,500 (1,804) 3,696 340 (340) —
Retail agreements 25-35 31,000 (985) 30,015 8,500 (3,627) 4,873
Franchise agreements 25 70,000 (2,217) 67,783 21,900 (5,421) 16,479
Manufacturing agreements 25 70,000 (2,216) 67,784 — — —
Other intangibles 1-5 150 (30) 120 — — —
Franchise rights 1-5 1,913 (784) 1,129 2,995 (1,285) 1,710
$ 902,063 $ (9,191) $ 892,872 $ 247,965 $ (12,903) $ 235,062
The following table represents future estimated amortization expense of intangible assets with finite lives:
Estimated
amortization
Years ending December 31, expense
(in thousands)
2008 10,898
2009 9,063
2010 7,190
2011 6,735
2012 6,661
Thereafter 132,325
Total $ 172,872
86