GNC 2008 Annual Report Download - page 54
Download and view the complete annual report
Please find page 54 of the 2008 GNC annual report below. You can navigate through the pages in the report by either clicking on the pages listed below, or by using the keyword search tool below to find specific information within the annual report.-
 1
1 -
2
-
3
-
4
-
5
-
6
-
7
-
8
-
9
-
10
-
11
-
12
-
13
-
14
-
15
-
16
-
17
-
18
-
19
-
20
-
21
-
22
-
23
-
24
-
25
-
26
-
27
-
28
-
29
-
30
-
31
-
32
-
33
-
34
-
35
-
36
-
37
-
38
-
39
-
40
-
41
-
42
-
43
-
 44
44 -
 45
45 -
 46
46 -
 47
47 -
 48
48 -
 49
49 -
 50
50 -
 51
51 -
 52
52 -
 53
53 -
 54
54 -
 55
55 -
 56
56 -
 57
57 -
 58
58 -
 59
59 -
 60
60 -
 61
61 -
 62
62 -
 63
63 -
 64
64 -
65
-
66
-
67
-
68
-
69
-
70
-
71
-
72
-
73
-
74
-
75
-
76
-
77
-
78
-
79
-
80
-
81
-
82
-
83
-
84
-
85
-
86
-
87
-
88
-
89
-
90
-
91
-
92
-
93
-
94
-
95
-
96
-
97
-
98
-
99
-
100
-
101
-
102
-
103
-
104
-
105
-
106
-
107
-
108
-
109
-
110
-
111
-
112
-
113
-
114
-
115
-
116
-
117
-
118
-
119
-
120
-
121
-
122
-
123
-
124
-
125
-
126
-
127
-
128
-
129
-
130
-
131
-
132
-
133
-
134
-
135
-
136
-
137
-
138
-
139
-
140
-
141
-
142
-
143
-
144
-
145
-
146
-
147
-
148
-
149
-
150
-
151
-
152
-
153
-
154
-
155
-
156
-
157
-
158
-
159
-
160
-
161
-
162
-
163
-
164
-
165
-
166
-
167
-
168
-
169
-
170
-
171
-
172
-
173
-
174
-
175
-
176
-
177
-
178
-
179
-
180
-
181
-
182
-
183
-
184
-
185
-
186
-
187
-
188
-
189
-
190
-
191
-
192
-
193
-
194
-
195
-
196
-
197
-
198
-
199
-
200
-
201
-
202
-
203
-
204
-
205
-
206
-
207
-
208
-
209
-
210
-
211
-
212
-
213
-
214
-
215
-
216
-
217
-
218
-
219
-
220
-
221
-
222
-
223
-
224
-
225
-
226
-
227
-
228
-
229
-
230
-
231
-
232
-
233
-
234
-
235
-
236
-
237
-
238
-
239
-
240
-
241
-
242
-
243
-
244
-
245
-
246
-
247
-
248
-
249
-
250
-
251
-
252
-
253
-
254
-
255
-
256
-
257
-
258
-
259
-
260
-
261
-
262
-
263
-
264
-
265
-
266
-
267
-
268
-
269
-
270
-
271
-
272
-
273
-
274
-
275
-
276
-
277
-
278
-
279
-
280
-
281
-
282
 |
 |

Table of Contents
same period in 2005. This increase was primarily a result of increased fuel costs, as well as the cost of common carriers, offset by reduced
wages and other operating expenses in our distribution centers.
Corporate Costs. Corporate overhead cost increased $36.3 million, or 65.9%, to $91.4 million for the year ended December 31, 2006
compared to $55.1 million for the same period in 2005. This increase was primarily the result of increases in: (1) incentive compensation
expense, including discretionary payments to option holders; (2) professional fees; and (3) accruals for legal settlements, offset by decreases in
severance and self-insurance costs.
Other expense/income. Other expense for the year ended December 31, 2006 was $1.2 million, as a result of the loss on the sale of our
Australian subsidiary. Other income for the year ended December 31, 2005 was $2.5 million, which was the recognition of transaction fee
income related to the transfer of our Australian franchise rights.
Interest Expense
Interest expense decreased $3.5 million, or 8.1%, to $39.6 million for the year ended December 31, 2006 compared to $43.1 million for
the same period in 2005. This decrease was primarily attributable to the write-off of $3.9 million of deferred financing fees in the first quarter of
2005 resulting from the early extinguishment of debt and an increase in other interest income, partially offset by an increase in our variable
interest rate on our senior credit facility.
Income Tax Expense
We recognized $22.2 million of consolidated income tax expense during the year ended December 31, 2006 compared to $10.9 million
for the same period of 2005. The increased tax expense for the year ended December 31, 2006, was primarily the result of an increase in
income before income taxes of $30.1 million. The effective tax rate remained relatively consistent for the year ended December 31, 2006, and
was 37.3%, compared to 36.8% for the same period in 2005.
Net Income
As a result of the foregoing, consolidated net income increased $18.8 million, or 101.1%, to $37.4 million for the year ended
December 31, 2006 compared to $18.6 million for the same period in 2005. Net income, as a percentage of net revenue, was 2.5% for the year
ended December 31, 2006 and 1.4% for the year ended December 31, 2005.
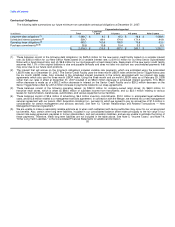
Liquidity and Capital Resources
At December 31, 2007, we had $28.9 million in cash and cash equivalents and $258.1 million in working capital compared with
$24.1 million in cash and cash equivalents and $249.6 million in working capital at December 31, 2006. The $8.5 million increase in working
capital was primarily driven by increases in inventory and receivables offset by increases in accrued interest and current portion of long-term
debt.
Cash Provided by Operating Activities
Cash provided by operating activities was $41.1 million, $74.6 million and $64.2 million during the years ended December 31, 2007,
2006, and 2005, respectively. The primary reason for the changes in each year was the change in net income between each of the periods and
changes in working capital accounts. Net income decreased $69.7 million for the year ended December 31, 2007 compared with the same
period in 2006. Net income increased $18.8 million for the year ended December 31, 2006 compared with the same period in 2005.
For the year ended December 31, 2007, inventory increased $8.5 million, as a result of increases in our finished goods and a decrease in
our reserves. Franchise notes receivable decreased $3.5 million for the year ended December 31, 2007, as a result of payments on existing
notes; reduction in our receivable 50