GNC 2008 Annual Report Download - page 279
Download and view the complete annual report
Please find page 279 of the 2008 GNC annual report below. You can navigate through the pages in the report by either clicking on the pages listed below, or by using the keyword search tool below to find specific information within the annual report.-
 1
1 -
2
-
3
-
4
-
5
-
6
-
7
-
8
-
9
-
10
-
11
-
12
-
13
-
14
-
15
-
16
-
17
-
18
-
19
-
20
-
21
-
22
-
23
-
24
-
25
-
26
-
27
-
28
-
29
-
30
-
31
-
32
-
33
-
34
-
35
-
36
-
37
-
38
-
39
-
40
-
41
-
42
-
43
-
44
-
45
-
46
-
47
-
48
-
49
-
50
-
51
-
52
-
53
-
54
-
55
-
56
-
57
-
58
-
59
-
60
-
61
-
62
-
63
-
64
-
65
-
66
-
67
-
68
-
69
-
70
-
71
-
72
-
73
-
74
-
75
-
76
-
77
-
78
-
79
-
80
-
81
-
82
-
83
-
84
-
85
-
86
-
87
-
88
-
89
-
90
-
91
-
92
-
93
-
94
-
95
-
96
-
97
-
98
-
99
-
100
-
101
-
102
-
103
-
104
-
105
-
106
-
107
-
108
-
109
-
110
-
111
-
112
-
113
-
114
-
115
-
116
-
117
-
118
-
119
-
120
-
121
-
122
-
123
-
124
-
125
-
126
-
127
-
128
-
129
-
130
-
131
-
132
-
133
-
134
-
135
-
136
-
137
-
138
-
139
-
140
-
141
-
142
-
143
-
144
-
145
-
146
-
147
-
148
-
149
-
150
-
151
-
152
-
153
-
154
-
155
-
156
-
157
-
158
-
159
-
160
-
161
-
162
-
163
-
164
-
165
-
166
-
167
-
168
-
169
-
170
-
171
-
172
-
173
-
174
-
175
-
176
-
177
-
178
-
179
-
180
-
181
-
182
-
183
-
184
-
185
-
186
-
187
-
188
-
189
-
190
-
191
-
192
-
193
-
194
-
195
-
196
-
197
-
198
-
199
-
200
-
201
-
202
-
203
-
204
-
205
-
206
-
207
-
208
-
209
-
210
-
211
-
212
-
213
-
214
-
215
-
216
-
217
-
218
-
219
-
220
-
221
-
222
-
223
-
224
-
225
-
226
-
227
-
228
-
229
-
230
-
231
-
232
-
233
-
234
-
235
-
236
-
237
-
238
-
239
-
240
-
241
-
242
-
243
-
244
-
245
-
246
-
247
-
248
-
249
-
250
-
251
-
252
-
253
-
254
-
255
-
256
-
257
-
258
-
259
-
260
-
261
-
262
-
263
-
264
-
265
-
266
-
267
-
268
-
 269
269 -
 270
270 -
 271
271 -
 272
272 -
 273
273 -
 274
274 -
 275
275 -
 276
276 -
 277
277 -
 278
278 -
 279
279 -
 280
280 -
 281
281 -
 282
282
 |
 |
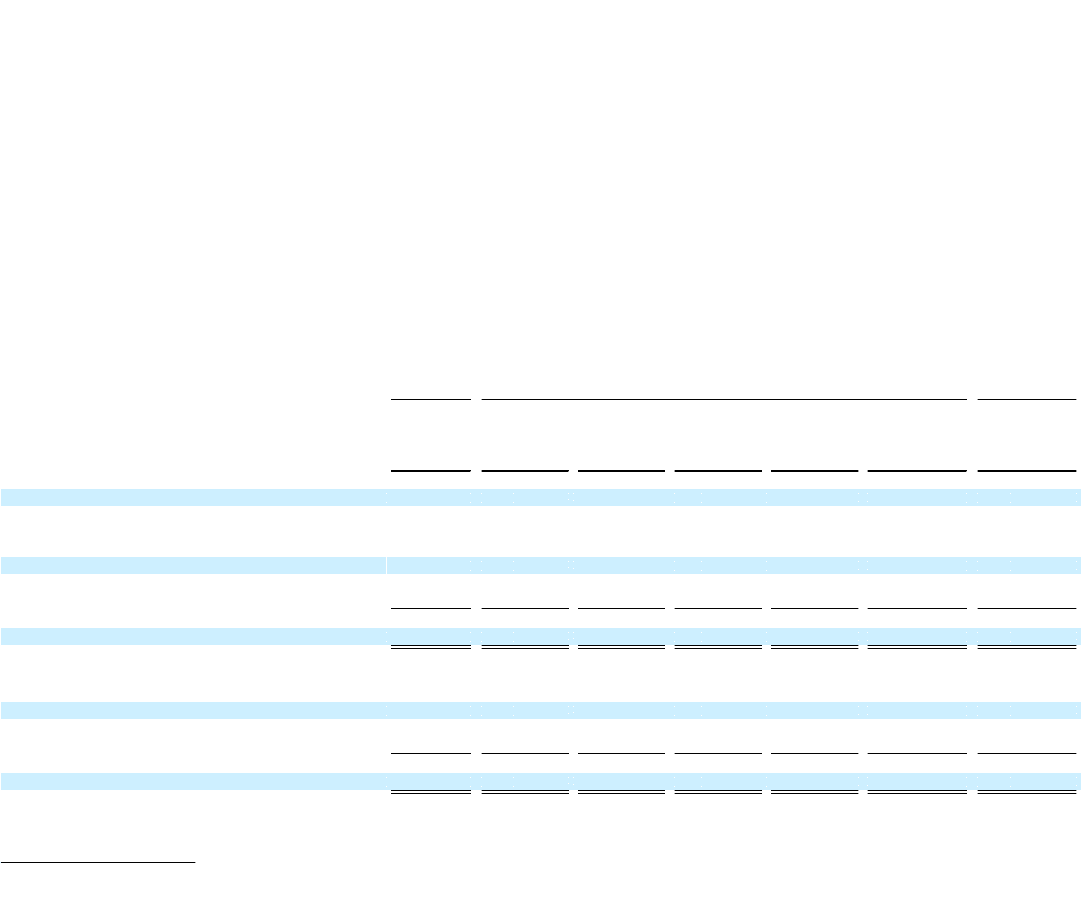
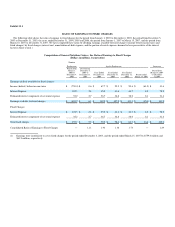
Exhibit 12.1
RATIO OF EARNINGS TO FIXED CHARGES
The following table shows the ratio of earnings to fixed charges for the period from January 1, 2003 to December 4, 2003, the period from December 5,
2003 to December 31, 2003, the years ended December 31, 2004, 2005 and 2006, the period from January 1, 2007 to March 15, 2007, and the period from
March 16, 2007 to December 31, 2007. We have computed these ratios by dividing earnings available for fixed charges (income before income taxes and
fixed charges) by fixed charges (interest cost, amortization of debt expense, and the portion of rental expenses deemed to be representative of the interest
factor in those rentals.)
Computation of General Nutrition Centers, Inc. Ratio of Earnings to Fixed Charges
(Dollars in millions, except ratios)
Numico
Predecessor Apollo Predecessor Successor
Period from Period from
January 1, December 5, Period from
2003 to 2003 to Year Ended Year Ended Year Ended March 16, 2007
December 4, December 31, December 31, December 31, December 31, Period ended to December
2003 2003 2004 2005 2006 March 15, 2007 31,2007
Earnings (deficit) available for fixed charges:
Income (deficit) before income taxes $ (759.4) $ 0.6 $ 67.7 $ 29.5 $ 59.6 $ (61.9) $ 31.6
Interest Expense 122.5 2.8 35.5 41.6 43.7 8.5 78.2
Estimated interest component of net rental expense 35.2 2.7 36.7 36.8 38.0 8.1 31.4
Earnings available for fixed charges $ (601.7) $ 6.1 $ 139.9 $ 107.9 $ 141.3 $ (45.3) $ 141.2
Fixed Charges:
Interest Expense $ 122.5 $ 2.8 $ 35.5 $ 41.6 $ 43.7 $ 8.5 $ 78.2
Estimated interest component of net rental expense 35.2 2.7 36.7 36.8 38.0 8.1 31.4
Total fixed charges $ 157.7 $ 5.5 $ 72.2 $ 78.4 $ 81.7 $ 16.6 $ 109.6
Consolidated Ratio of Earnings to Fixed Charges — 1.11 1.94 1.38 1.73 — 1.29
(1) Earnings were insufficient to cover fixed charges for the period ended December 4, 2003, and the period ended March 15, 2007 by $759.4 million and
$61.9 million, respectively.