GNC 2008 Annual Report Download - page 51
Download and view the complete annual report
Please find page 51 of the 2008 GNC annual report below. You can navigate through the pages in the report by either clicking on the pages listed below, or by using the keyword search tool below to find specific information within the annual report.-
 1
1 -
2
-
3
-
4
-
5
-
6
-
7
-
8
-
9
-
10
-
11
-
12
-
13
-
14
-
15
-
16
-
17
-
18
-
19
-
20
-
21
-
22
-
23
-
24
-
25
-
26
-
27
-
28
-
29
-
30
-
31
-
32
-
33
-
34
-
35
-
36
-
37
-
38
-
39
-
40
-
 41
41 -
 42
42 -
 43
43 -
 44
44 -
 45
45 -
 46
46 -
 47
47 -
 48
48 -
 49
49 -
 50
50 -
 51
51 -
 52
52 -
 53
53 -
 54
54 -
 55
55 -
 56
56 -
 57
57 -
 58
58 -
 59
59 -
 60
60 -
 61
61 -
62
-
63
-
64
-
65
-
66
-
67
-
68
-
69
-
70
-
71
-
72
-
73
-
74
-
75
-
76
-
77
-
78
-
79
-
80
-
81
-
82
-
83
-
84
-
85
-
86
-
87
-
88
-
89
-
90
-
91
-
92
-
93
-
94
-
95
-
96
-
97
-
98
-
99
-
100
-
101
-
102
-
103
-
104
-
105
-
106
-
107
-
108
-
109
-
110
-
111
-
112
-
113
-
114
-
115
-
116
-
117
-
118
-
119
-
120
-
121
-
122
-
123
-
124
-
125
-
126
-
127
-
128
-
129
-
130
-
131
-
132
-
133
-
134
-
135
-
136
-
137
-
138
-
139
-
140
-
141
-
142
-
143
-
144
-
145
-
146
-
147
-
148
-
149
-
150
-
151
-
152
-
153
-
154
-
155
-
156
-
157
-
158
-
159
-
160
-
161
-
162
-
163
-
164
-
165
-
166
-
167
-
168
-
169
-
170
-
171
-
172
-
173
-
174
-
175
-
176
-
177
-
178
-
179
-
180
-
181
-
182
-
183
-
184
-
185
-
186
-
187
-
188
-
189
-
190
-
191
-
192
-
193
-
194
-
195
-
196
-
197
-
198
-
199
-
200
-
201
-
202
-
203
-
204
-
205
-
206
-
207
-
208
-
209
-
210
-
211
-
212
-
213
-
214
-
215
-
216
-
217
-
218
-
219
-
220
-
221
-
222
-
223
-
224
-
225
-
226
-
227
-
228
-
229
-
230
-
231
-
232
-
233
-
234
-
235
-
236
-
237
-
238
-
239
-
240
-
241
-
242
-
243
-
244
-
245
-
246
-
247
-
248
-
249
-
250
-
251
-
252
-
253
-
254
-
255
-
256
-
257
-
258
-
259
-
260
-
261
-
262
-
263
-
264
-
265
-
266
-
267
-
268
-
269
-
270
-
271
-
272
-
273
-
274
-
275
-
276
-
277
-
278
-
279
-
280
-
281
-
282
 |
 |

Table of Contents
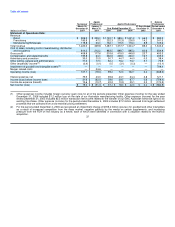
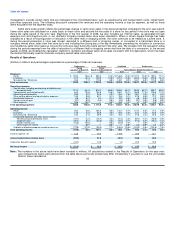
of selling-related expenses of $26.4 million, a contract termination fee paid to our previous owner of $7.5 million, and other costs of $0.7 million.
Other expense/income. Other expense for the year ended December 31, 2006 was $1.2 million, as a result of the loss on the sale of our
Australian subsidiary.
Interest Expense
Interest expense increased $78.9 million, to $118.5 million for the year ended December 31, 2007 compared to $39.6 million for the
same period in 2006. This increase was primarily attributable to the write-off of $34.8 million in call premiums and deferred fee write-offs, and
an increase in our debt and interest rates, as a result of the Merger.
Income Tax Expense
We recognized $1.9 million of consolidated income tax expense during the year ended December 31, 2007 compared to $22.2 million for
the same period of 2006. The effective tax rate for the year ended December 31, 2006 was 37.3%.
Net Income
As a result of the foregoing, consolidated net income decreased $69.7 million, to ($32.3) million for the year ended December 31, 2007
compared to $37.4 million for the same period in 2006. Net income, as a percentage of net revenue, was (2.1%) for the year ended
December 31, 2007 and 2.5% for the year ended December 31, 2006.
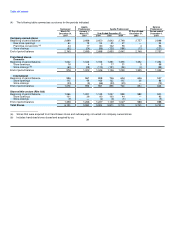
Comparison of the Years Ended December 31, 2006 and 2005
Revenues
Our consolidated net revenues increased $169.4 million, or 12.9%, to $1,487.1 million for the year ended December 31, 2006 compared
to $1,317.7 million for the same period in 2005. The increase was primarily the result of increased same store sales in our Retail and Franchise
segments and increased revenue in our Manufacturing/Wholesale segment due to a higher volume of third-party contracts for manufacturing
sales for certain soft-gelatin products.
Retail. Revenues in our Retail segment increased $133.3 million, or 13.5%, to $1,122.7 million for the year ended December 31, 2006
compared to $989.4 million for the same period in 2005. The sales increase was the result of improved same store sales of 11.1% in our
domestic company-owned stores and 14.1% in our Canadian company-owned stores. Included in our domestic revenue was $17.2 million from
our gnc.com website that began e-commerce in late December 2005. These same store increases came from growth in all of our major product
categories including vitamins, minerals, herbs and supplements, sports nutrition and diet. Our company-owned store base increased by 37
stores to 2,554 domestically, primarily due to franchised store acquisitions, and our Canadian store base increased to 134 at December 31,
2006 compared to 133 at December 31, 2005.
Franchise. Revenues in our Franchise segment increased $19.5 million, or 9.2%, to $232.3 million for the year ended December 31,
2006 compared to $212.8 million for the same period in 2005. This improvement in revenue resulted primarily from increased wholesale product
sales of $10.4 million to our domestic franchisees and $8.0 million to our international franchisees and an increase in other revenue, consisting
primarily of royalties from franchisees, of $1.1 million. Our domestic franchised stores recognized improved retail sales for the year ended
December 31, 2006, as evidenced by an increase in same store sales for these stores of 5.7%. Our domestic franchised store base declined by
110 stores, to 1,046 at December 31, 2006, from 1,156 at December 31, 2005. Since the beginning of 2005, we have closed 85 domestic
franchised stores and acquired 181 that were converted into company-owned stores. Our
47