GNC 2008 Annual Report Download - page 72
Download and view the complete annual report
Please find page 72 of the 2008 GNC annual report below. You can navigate through the pages in the report by either clicking on the pages listed below, or by using the keyword search tool below to find specific information within the annual report.-
 1
1 -
2
-
3
-
4
-
5
-
6
-
7
-
8
-
9
-
10
-
11
-
12
-
13
-
14
-
15
-
16
-
17
-
18
-
19
-
20
-
21
-
22
-
23
-
24
-
25
-
26
-
27
-
28
-
29
-
30
-
31
-
32
-
33
-
34
-
35
-
36
-
37
-
38
-
39
-
40
-
41
-
42
-
43
-
44
-
45
-
46
-
47
-
48
-
49
-
50
-
51
-
52
-
53
-
54
-
55
-
56
-
57
-
58
-
59
-
60
-
61
-
 62
62 -
 63
63 -
 64
64 -
 65
65 -
 66
66 -
 67
67 -
 68
68 -
 69
69 -
 70
70 -
 71
71 -
 72
72 -
 73
73 -
 74
74 -
 75
75 -
 76
76 -
 77
77 -
 78
78 -
 79
79 -
 80
80 -
 81
81 -
 82
82 -
83
-
84
-
85
-
86
-
87
-
88
-
89
-
90
-
91
-
92
-
93
-
94
-
95
-
96
-
97
-
98
-
99
-
100
-
101
-
102
-
103
-
104
-
105
-
106
-
107
-
108
-
109
-
110
-
111
-
112
-
113
-
114
-
115
-
116
-
117
-
118
-
119
-
120
-
121
-
122
-
123
-
124
-
125
-
126
-
127
-
128
-
129
-
130
-
131
-
132
-
133
-
134
-
135
-
136
-
137
-
138
-
139
-
140
-
141
-
142
-
143
-
144
-
145
-
146
-
147
-
148
-
149
-
150
-
151
-
152
-
153
-
154
-
155
-
156
-
157
-
158
-
159
-
160
-
161
-
162
-
163
-
164
-
165
-
166
-
167
-
168
-
169
-
170
-
171
-
172
-
173
-
174
-
175
-
176
-
177
-
178
-
179
-
180
-
181
-
182
-
183
-
184
-
185
-
186
-
187
-
188
-
189
-
190
-
191
-
192
-
193
-
194
-
195
-
196
-
197
-
198
-
199
-
200
-
201
-
202
-
203
-
204
-
205
-
206
-
207
-
208
-
209
-
210
-
211
-
212
-
213
-
214
-
215
-
216
-
217
-
218
-
219
-
220
-
221
-
222
-
223
-
224
-
225
-
226
-
227
-
228
-
229
-
230
-
231
-
232
-
233
-
234
-
235
-
236
-
237
-
238
-
239
-
240
-
241
-
242
-
243
-
244
-
245
-
246
-
247
-
248
-
249
-
250
-
251
-
252
-
253
-
254
-
255
-
256
-
257
-
258
-
259
-
260
-
261
-
262
-
263
-
264
-
265
-
266
-
267
-
268
-
269
-
270
-
271
-
272
-
273
-
274
-
275
-
276
-
277
-
278
-
279
-
280
-
281
-
282
 |
 |

Table of Contents
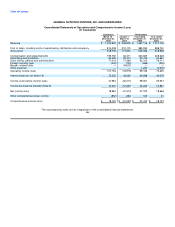
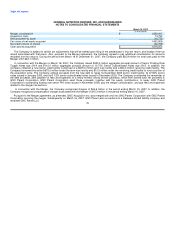
GENERAL NUTRITION CENTERS, INC. AND SUBSIDIARIES
Consolidated Statements of Cash Flows
(in thousands)
Successor Predecessor
Period Period
March 16 - January 1 -
December 31, March 15, Year ended December 31,
2007 2007 2006 2005
CASH FLOWS FROM OPERATING ACTIVITIES:
Net income (loss) $ 18,984 $ (51,314) $ 37,375 $ 18,666
Depreciation expense 20,810 6,510 34,583 37,045
Loss on fixed asset disposal — — 220 665
Loss on sale of subsidiary — — 1,203 —
Deferred fee writedown — early debt extinguishment — 11,680 890 3,890
Amortization of intangible assets 9,191 865 4,595 3,990
Amortization of deferred financing fees 2,921 589 2,966 2,825
Amortization of original issue discount 247 — — —
Increase in provision for inventory losses 10,400 2,247 9,816 9,353
Non-cash stock based compensation 1,907 4,124 2,528 632
Decrease in provision for losses on accounts receivable (335) (39) (1,982) 1,784
Decrease (increase) in net deferred taxes 9,303 (3,874) (3,588) 1,321
Changes in assets and liabilities:
(Increase) decrease in receivables (10,752) 1,676 (2,334) (6,142)
Decrease (increase) in inventory, net (6,377) (2,128) (31,261) (33,259)
Decrease in franchise note receivables, net 2,587 912 4,649 6,650
(Increase) decrease in other assets (7,474) 3,394 (471) 6,078
(Decrease) increase in accounts payable (5,110) 3,749 787 (2,853)
(Decrease) increase in accrued taxes 12,619 (4,967) 2,601 2,431
Increase (decrease) in interest payable 18,110 (7,531) (346) 6,014
(Decrease) increase in accrued liabilities 10,882 (12,681) 12,342 5,096
Net cash provided by (used in) operating activities 87,913 (46,788) 74,573 64,186
CASH FLOWS FROM INVESTING ACTIVITIES:
Capital expenditures (28,851) (5,693) (23,846) (20,825)
Proceeds from sale of subsidiary — — 1,356 —
Acquisition of the Company (1,642,061) — — —
Sales of corporate stores to franchisees 77 — 21 23
Store acquisition costs (489) (555) (965) (733)
Net cash used in investing activities (1,671,324) (6,248) (23,434) (21,535)
CASH FLOWS FROM FINANCING ACTIVITIES:
Issuance of new equity 552,291 — — —
Return of capital to Parent (314) — (18,618) (901)
Restricted payment made by General Nutrition Centers, Inc. to GNC Corporation Common
Stockholders — — (49,934) —
Contribution from selling shareholders — 463,393 — —
Increase (decrease) in cash overdrafts 4,124 (4,136) (927) 919
Borrowings from new revolving credit facility 10,500 — — —
Payments on new revolving credit facility (10,500) — — —
Borrowings from new senior credit facility 675,000 — — —
Proceeds from issuance of new senior sub notes 110,000 — — —
Proceeds from issuance of new senior notes 297,000 — — —
Proceeds from issuance of 8 5/8% senior notes — — — 150,000
Redemption of 8 5/8% senior notes — (150,000) — —
Redemption of 8 1/2% senior notes — (215,000) — —
Payment of 2003 senior credit facility — (55,290) — —
Payments on long-term debt (6,021) (334) (41,974) (187,014)
Financing fees (29,298) — (1,674) (4,710)
Net cash provided by (used in) financing activities 1,602,782 38,633 (113,127) (41,706)
Effect of exchange rate on cash (29) (165) 55 (93)
Net increase (decrease) in cash 19,342 (14,568) (61,933) 852
Beginning balance, cash 9,512 24,080 86,013 85,161
Ending balance, cash $ 28,854 $ 9,512 $ 24,080 $ 86,013
The accompanying notes are an integral part of the consolidated financial statements.
68