GNC 2008 Annual Report Download - page 52
Download and view the complete annual report
Please find page 52 of the 2008 GNC annual report below. You can navigate through the pages in the report by either clicking on the pages listed below, or by using the keyword search tool below to find specific information within the annual report.-
 1
1 -
2
-
3
-
4
-
5
-
6
-
7
-
8
-
9
-
10
-
11
-
12
-
13
-
14
-
15
-
16
-
17
-
18
-
19
-
20
-
21
-
22
-
23
-
24
-
25
-
26
-
27
-
28
-
29
-
30
-
31
-
32
-
33
-
34
-
35
-
36
-
37
-
38
-
39
-
40
-
41
-
 42
42 -
 43
43 -
 44
44 -
 45
45 -
 46
46 -
 47
47 -
 48
48 -
 49
49 -
 50
50 -
 51
51 -
 52
52 -
 53
53 -
 54
54 -
 55
55 -
 56
56 -
 57
57 -
 58
58 -
 59
59 -
 60
60 -
 61
61 -
 62
62 -
63
-
64
-
65
-
66
-
67
-
68
-
69
-
70
-
71
-
72
-
73
-
74
-
75
-
76
-
77
-
78
-
79
-
80
-
81
-
82
-
83
-
84
-
85
-
86
-
87
-
88
-
89
-
90
-
91
-
92
-
93
-
94
-
95
-
96
-
97
-
98
-
99
-
100
-
101
-
102
-
103
-
104
-
105
-
106
-
107
-
108
-
109
-
110
-
111
-
112
-
113
-
114
-
115
-
116
-
117
-
118
-
119
-
120
-
121
-
122
-
123
-
124
-
125
-
126
-
127
-
128
-
129
-
130
-
131
-
132
-
133
-
134
-
135
-
136
-
137
-
138
-
139
-
140
-
141
-
142
-
143
-
144
-
145
-
146
-
147
-
148
-
149
-
150
-
151
-
152
-
153
-
154
-
155
-
156
-
157
-
158
-
159
-
160
-
161
-
162
-
163
-
164
-
165
-
166
-
167
-
168
-
169
-
170
-
171
-
172
-
173
-
174
-
175
-
176
-
177
-
178
-
179
-
180
-
181
-
182
-
183
-
184
-
185
-
186
-
187
-
188
-
189
-
190
-
191
-
192
-
193
-
194
-
195
-
196
-
197
-
198
-
199
-
200
-
201
-
202
-
203
-
204
-
205
-
206
-
207
-
208
-
209
-
210
-
211
-
212
-
213
-
214
-
215
-
216
-
217
-
218
-
219
-
220
-
221
-
222
-
223
-
224
-
225
-
226
-
227
-
228
-
229
-
230
-
231
-
232
-
233
-
234
-
235
-
236
-
237
-
238
-
239
-
240
-
241
-
242
-
243
-
244
-
245
-
246
-
247
-
248
-
249
-
250
-
251
-
252
-
253
-
254
-
255
-
256
-
257
-
258
-
259
-
260
-
261
-
262
-
263
-
264
-
265
-
266
-
267
-
268
-
269
-
270
-
271
-
272
-
273
-
274
-
275
-
276
-
277
-
278
-
279
-
280
-
281
-
282
 |
 |

Table of Contents
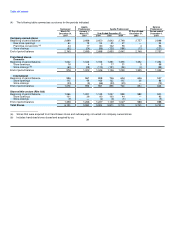
international franchised store base increased by 103 stores to 961 at December 31, 2006 compared to 858 at December 31, 2005.
Manufacturing/Wholesale. Revenues in our Manufacturing/Wholesale segment, which includes third-party sales from our manufacturing
facilities in South Carolina and Australia, until it was sold in November 2006, as well as wholesale sales to Rite Aid and drugstore.com,
increased $16.6 million, or 14.4%, to $132.1 million for the year ended December 31, 2006 compared to $115.5 million for the same period in
2005. This increase was generated primarily by the Greenville, South Carolina manufacturing facility, which had an increase of $17.8 million,
principally as a result of utilizing available manufacturing capacity for third-party product contract manufacturing. We also had an increase of
$1.8 million in sales to Rite Aid. These increases were partially offset by decreased sales to drugstore.com of $2.1 million and a decrease in
revenue at our Australia facility of $0.9 million.
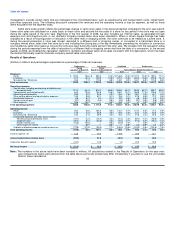
Cost of Sales
Consolidated cost of sales, which includes product costs, costs of warehousing, distribution and occupancy costs, increased
$84.8 million, or 9.4%, to $983.5 million for the year ended December 31, 2006 compared to $898.7 million for the same period in 2005.
Consolidated cost of sales, as a percentage of net revenue, was 66.1% for the year ended December 31, 2006 compared to 68.2% for the year
ended December 31, 2005.
Product costs. Product costs increased $77.1 million, or 11.8%, to $732.8 million for the year ended December 31, 2006 compared to
$655.7 million for the same period in 2005. This increase is primarily due to increased sales volumes at the retail stores. Consolidated product
costs, as a percentage of net revenue, were 49.3% for the year ended December 31, 2006 compared to 49.8% for the year ended
December 31, 2005. This improvement was due to increased volume in our Retail and Franchise segments, which generate higher margins
than Manufacturing/Wholesale.
Warehousing and distribution costs. Warehousing and distribution costs increased $1.1 million, or 2.1%, to $52.5 million for the year
ended December 31, 2006 compared to $51.4 million for the same period in 2005. This increase was primarily a result of increased fuel costs
that affected our private fleet, as well as the cost of common carriers, offset by cost savings in wages, benefits, and other distribution costs.
Consolidated warehousing and distribution costs, as a percentage of net revenue, were 3.5% for the year ended December 31, 2006 compared
to 3.9% for the year ended December 31, 2005.
Occupancy costs. Occupancy costs increased $6.6 million, or 3.4%, to $198.2 million for the year ended December 31, 2006 compared
to $191.6 million for the same period in 2005. This increase was the result of higher lease-related costs of $6.2 million, which was the result of a
larger store base and normal increases in lease costs, and utility costs of $1.1 million, which were partially offset by a reduction in depreciation
expense and other occupancy related expenses of $0.7 million. Consolidated occupancy costs, as a percentage of net revenue, were 13.3% for
the year ended December 31, 2006 compared to 14.5% for the year ended December 31, 2005.
Selling, General and Administrative ("SG&A") Expenses
Our consolidated SG&A expenses, including compensation and related benefits, advertising and promotion expense, other selling,
general and administrative expenses, and amortization expense, increased $54.4 million, or 15.6%, to $403.9 million, for the year ended
December 31, 2006 compared to $349.5 million for the same period in 2005. These expenses, as a percentage of net revenue, were 27.2% for
the year ended December 31, 2006 compared to 26.5% for the year ended December 31, 2005.
Compensation and related benefits. Compensation and related benefits increased $32.2 million, or 14.1%, to $260.8 million for the year
ended December 31, 2006 compared to $228.6 million for the same period in 2005. The increase was the result of increases in: (1) incentives
and commission expense of $29.4 million, a portion of which related to discretionary payments to employee stock option holders of
$19.1 million and the remainder was incentive expense of $10.3 million; (2) base wage expense, primarily in our
48