GNC 2008 Annual Report Download - page 45
Download and view the complete annual report
Please find page 45 of the 2008 GNC annual report below. You can navigate through the pages in the report by either clicking on the pages listed below, or by using the keyword search tool below to find specific information within the annual report.-
 1
1 -
2
-
3
-
4
-
5
-
6
-
7
-
8
-
9
-
10
-
11
-
12
-
13
-
14
-
15
-
16
-
17
-
18
-
19
-
20
-
21
-
22
-
23
-
24
-
25
-
26
-
27
-
28
-
29
-
30
-
31
-
32
-
33
-
34
-
 35
35 -
 36
36 -
 37
37 -
 38
38 -
 39
39 -
 40
40 -
 41
41 -
 42
42 -
 43
43 -
 44
44 -
 45
45 -
 46
46 -
 47
47 -
 48
48 -
 49
49 -
 50
50 -
 51
51 -
 52
52 -
 53
53 -
 54
54 -
 55
55 -
56
-
57
-
58
-
59
-
60
-
61
-
62
-
63
-
64
-
65
-
66
-
67
-
68
-
69
-
70
-
71
-
72
-
73
-
74
-
75
-
76
-
77
-
78
-
79
-
80
-
81
-
82
-
83
-
84
-
85
-
86
-
87
-
88
-
89
-
90
-
91
-
92
-
93
-
94
-
95
-
96
-
97
-
98
-
99
-
100
-
101
-
102
-
103
-
104
-
105
-
106
-
107
-
108
-
109
-
110
-
111
-
112
-
113
-
114
-
115
-
116
-
117
-
118
-
119
-
120
-
121
-
122
-
123
-
124
-
125
-
126
-
127
-
128
-
129
-
130
-
131
-
132
-
133
-
134
-
135
-
136
-
137
-
138
-
139
-
140
-
141
-
142
-
143
-
144
-
145
-
146
-
147
-
148
-
149
-
150
-
151
-
152
-
153
-
154
-
155
-
156
-
157
-
158
-
159
-
160
-
161
-
162
-
163
-
164
-
165
-
166
-
167
-
168
-
169
-
170
-
171
-
172
-
173
-
174
-
175
-
176
-
177
-
178
-
179
-
180
-
181
-
182
-
183
-
184
-
185
-
186
-
187
-
188
-
189
-
190
-
191
-
192
-
193
-
194
-
195
-
196
-
197
-
198
-
199
-
200
-
201
-
202
-
203
-
204
-
205
-
206
-
207
-
208
-
209
-
210
-
211
-
212
-
213
-
214
-
215
-
216
-
217
-
218
-
219
-
220
-
221
-
222
-
223
-
224
-
225
-
226
-
227
-
228
-
229
-
230
-
231
-
232
-
233
-
234
-
235
-
236
-
237
-
238
-
239
-
240
-
241
-
242
-
243
-
244
-
245
-
246
-
247
-
248
-
249
-
250
-
251
-
252
-
253
-
254
-
255
-
256
-
257
-
258
-
259
-
260
-
261
-
262
-
263
-
264
-
265
-
266
-
267
-
268
-
269
-
270
-
271
-
272
-
273
-
274
-
275
-
276
-
277
-
278
-
279
-
280
-
281
-
282
 |
 |

Table of Contents
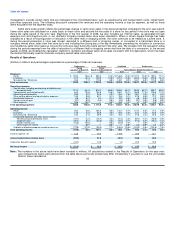
operations are subject to our available manufacturing capacity, and we anticipate that these revenues will remain stable over the next
five years.
• A significant portion of our business infrastructure is comprised of fixed operating costs. Our vertically integrated distribution network
and manufacturing capacity can support higher sales volume without adding significant incremental costs. We therefore expect our
operating expenses to grow at a lesser rate than our revenues, resulting in significant operating leverage in our business.
The following trends and uncertainties in our industry could positively or negatively affect our operating performance:
• volatility in the diet category;
• broader consumer awareness of health and wellness issues and rising healthcare costs;
• interest in, and demand for, condition-specific products based on scientific research;
• significant effects of favorable and unfavorable publicity on consumer demand;
• lack of a single product or group of products dominating any one product category;
• rapidly evolving consumer preferences and demand for new products; and
• costs associated with complying with new and existing governmental regulation.
Executive Overview
In 2005, we undertook a series of strategic initiatives to rebuild the business and to establish a foundation for stronger future
performance. These initiatives were implemented in order to reverse declining sales trends, a lack of connectivity with our customers, and
deteriorating franchisee relations. In 2006 and 2007, we continued to focus on these strategies and continued to see favorable results. These
initiatives have allowed us to capitalize on our national footprint, brand awareness, and competitive positioning to improve our overall
performance. Specifically, we:
• introduced a single national pricing structure in order to simplify our pricing approach and improve our customer value perception;
• developed and executed a national, more diversified marketing program focused on competitive pricing of key items and reinforcing
GNC's well-recognized and dominant brand name among consumers;
• overhauled our field organization and store programs to improve our value-added customer shopping experience;
• focused our merchandising and marketing initiatives on driving increased traffic to our store locations, particularly with promotional
events outside of Gold Card week;
• improved supply chain and inventory management, resulting in better in-stock levels of products generally and "never out" levels of top
products;
• reinvigorated our proprietary new product development activities;
41