GNC 2008 Annual Report Download - page 41
Download and view the complete annual report
Please find page 41 of the 2008 GNC annual report below. You can navigate through the pages in the report by either clicking on the pages listed below, or by using the keyword search tool below to find specific information within the annual report.-
 1
1 -
2
-
3
-
4
-
5
-
6
-
7
-
8
-
9
-
10
-
11
-
12
-
13
-
14
-
15
-
16
-
17
-
18
-
19
-
20
-
21
-
22
-
23
-
24
-
25
-
26
-
27
-
28
-
29
-
30
-
 31
31 -
 32
32 -
 33
33 -
 34
34 -
 35
35 -
 36
36 -
 37
37 -
 38
38 -
 39
39 -
 40
40 -
 41
41 -
 42
42 -
 43
43 -
 44
44 -
 45
45 -
 46
46 -
 47
47 -
 48
48 -
 49
49 -
 50
50 -
 51
51 -
52
-
53
-
54
-
55
-
56
-
57
-
58
-
59
-
60
-
61
-
62
-
63
-
64
-
65
-
66
-
67
-
68
-
69
-
70
-
71
-
72
-
73
-
74
-
75
-
76
-
77
-
78
-
79
-
80
-
81
-
82
-
83
-
84
-
85
-
86
-
87
-
88
-
89
-
90
-
91
-
92
-
93
-
94
-
95
-
96
-
97
-
98
-
99
-
100
-
101
-
102
-
103
-
104
-
105
-
106
-
107
-
108
-
109
-
110
-
111
-
112
-
113
-
114
-
115
-
116
-
117
-
118
-
119
-
120
-
121
-
122
-
123
-
124
-
125
-
126
-
127
-
128
-
129
-
130
-
131
-
132
-
133
-
134
-
135
-
136
-
137
-
138
-
139
-
140
-
141
-
142
-
143
-
144
-
145
-
146
-
147
-
148
-
149
-
150
-
151
-
152
-
153
-
154
-
155
-
156
-
157
-
158
-
159
-
160
-
161
-
162
-
163
-
164
-
165
-
166
-
167
-
168
-
169
-
170
-
171
-
172
-
173
-
174
-
175
-
176
-
177
-
178
-
179
-
180
-
181
-
182
-
183
-
184
-
185
-
186
-
187
-
188
-
189
-
190
-
191
-
192
-
193
-
194
-
195
-
196
-
197
-
198
-
199
-
200
-
201
-
202
-
203
-
204
-
205
-
206
-
207
-
208
-
209
-
210
-
211
-
212
-
213
-
214
-
215
-
216
-
217
-
218
-
219
-
220
-
221
-
222
-
223
-
224
-
225
-
226
-
227
-
228
-
229
-
230
-
231
-
232
-
233
-
234
-
235
-
236
-
237
-
238
-
239
-
240
-
241
-
242
-
243
-
244
-
245
-
246
-
247
-
248
-
249
-
250
-
251
-
252
-
253
-
254
-
255
-
256
-
257
-
258
-
259
-
260
-
261
-
262
-
263
-
264
-
265
-
266
-
267
-
268
-
269
-
270
-
271
-
272
-
273
-
274
-
275
-
276
-
277
-
278
-
279
-
280
-
281
-
282
 |
 |
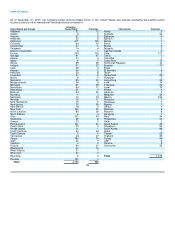
Table of Contents
Apollo Numico
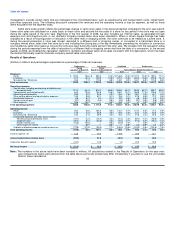
Successor Predecessor Apollo Predecessor Predecessor
March 16- January 1- 27 Days Ended Period ended
December 31, March 15, Year Ended December 31, December 31, December 4,
(dollars in millions) 2007 2007 2006 2005 2004 2003 2003
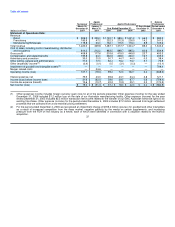
Statement of Operations Data:
Revenue:
Retail $ 909.3 $ 259.3 $1,122.7 $ 989.4 $1,001.8 $ 66.2 $ 993.3
Franchising 193.9 47.2 232.3 212.8 226.5 14.2 241.3
Manufacturing/Wholesale 119.8 23.3 132.1 115.5 116.4 8.9 105.6
Total revenue 1,223.0 329.8 1,487.1 1,317.7 1,344.7 89.3 1,340.2
Cost of sales, including costs of warehousing, distribution
and occupancy 814.2 212.2 983.5 898.7 895.2 63.6 934.9
Gross profit 408.8 117.6 503.6 419.0 449.5 25.7 405.3
Compensation and related benefits 195.8 64.3 260.8 228.6 230.0 16.7 235.0
Advertising and promotion 35.0 20.5 50.7 44.7 44.0 0.5 38.4
Other selling, general and administrative 71.3 17.3 92.4 76.2 73.7 5.1 70.9
Other (expense)/ income(1) (0.4) (0.1) 0.5 (3.1) (0.3) — (10.1)
Impairment of goodwill and intangible assets(2) — — — — — — 709.4
Merger related costs — 34.6 — — — — —
Operating income (loss) 107.1 (19.0) 99.2 72.6 102.1 3.4 (638.3)
Interest expense, net 75.5 43.0 39.6 43.1 34.4 2.8 121.1
Income (loss) before income taxes 31.6 (62.0) 59.6 29.5 67.7 0.6 (759.4)
Income tax expense (benefit) 12.6 (10.7) 22.2 10.9 25.1 0.2 (174.5)
Net income/ (loss) $ 19.0 $ (51.3) $ 37.4 $ 18.6 $ 42.6 $ 0.4 $ (584.9)
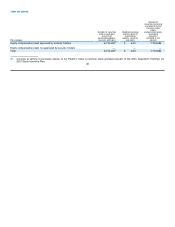
(1) Other (expense) income includes foreign currency (gain) loss for all of the periods presented. Other expense (income) for the year ended
December 31, 2006 included $1.2 million loss on the sale of our Australian manufacturing facility. Other expense (income) for the year
ended December 31, 2005 included $2.5 million transaction fee income related to the transfer of our GNC Australian franchise rights to an
existing franchisee. Other expense (income) for the period ended December 4, 2003 includes $7.2 million received from legal settlement
proceeds that we collected from a raw material pricing settlement.
(2) For the period ended December 4, 2003 we recognized an impairment charge of $709.4 million (pre-tax) for goodwill and other intangibles
as a result of increased competition from the mass market, negative publicity by the media on certain supplements, and increasing
pressure from the FDA on the industry as a whole, each of which were identified in connection with a valuation related to the Numico
acquisition. 37