GNC 2008 Annual Report Download - page 53
Download and view the complete annual report
Please find page 53 of the 2008 GNC annual report below. You can navigate through the pages in the report by either clicking on the pages listed below, or by using the keyword search tool below to find specific information within the annual report.-
 1
1 -
2
-
3
-
4
-
5
-
6
-
7
-
8
-
9
-
10
-
11
-
12
-
13
-
14
-
15
-
16
-
17
-
18
-
19
-
20
-
21
-
22
-
23
-
24
-
25
-
26
-
27
-
28
-
29
-
30
-
31
-
32
-
33
-
34
-
35
-
36
-
37
-
38
-
39
-
40
-
41
-
42
-
 43
43 -
 44
44 -
 45
45 -
 46
46 -
 47
47 -
 48
48 -
 49
49 -
 50
50 -
 51
51 -
 52
52 -
 53
53 -
 54
54 -
 55
55 -
 56
56 -
 57
57 -
 58
58 -
 59
59 -
 60
60 -
 61
61 -
 62
62 -
 63
63 -
64
-
65
-
66
-
67
-
68
-
69
-
70
-
71
-
72
-
73
-
74
-
75
-
76
-
77
-
78
-
79
-
80
-
81
-
82
-
83
-
84
-
85
-
86
-
87
-
88
-
89
-
90
-
91
-
92
-
93
-
94
-
95
-
96
-
97
-
98
-
99
-
100
-
101
-
102
-
103
-
104
-
105
-
106
-
107
-
108
-
109
-
110
-
111
-
112
-
113
-
114
-
115
-
116
-
117
-
118
-
119
-
120
-
121
-
122
-
123
-
124
-
125
-
126
-
127
-
128
-
129
-
130
-
131
-
132
-
133
-
134
-
135
-
136
-
137
-
138
-
139
-
140
-
141
-
142
-
143
-
144
-
145
-
146
-
147
-
148
-
149
-
150
-
151
-
152
-
153
-
154
-
155
-
156
-
157
-
158
-
159
-
160
-
161
-
162
-
163
-
164
-
165
-
166
-
167
-
168
-
169
-
170
-
171
-
172
-
173
-
174
-
175
-
176
-
177
-
178
-
179
-
180
-
181
-
182
-
183
-
184
-
185
-
186
-
187
-
188
-
189
-
190
-
191
-
192
-
193
-
194
-
195
-
196
-
197
-
198
-
199
-
200
-
201
-
202
-
203
-
204
-
205
-
206
-
207
-
208
-
209
-
210
-
211
-
212
-
213
-
214
-
215
-
216
-
217
-
218
-
219
-
220
-
221
-
222
-
223
-
224
-
225
-
226
-
227
-
228
-
229
-
230
-
231
-
232
-
233
-
234
-
235
-
236
-
237
-
238
-
239
-
240
-
241
-
242
-
243
-
244
-
245
-
246
-
247
-
248
-
249
-
250
-
251
-
252
-
253
-
254
-
255
-
256
-
257
-
258
-
259
-
260
-
261
-
262
-
263
-
264
-
265
-
266
-
267
-
268
-
269
-
270
-
271
-
272
-
273
-
274
-
275
-
276
-
277
-
278
-
279
-
280
-
281
-
282
 |
 |

Table of Contents
retail stores for part-time wages to support the increased sales volumes and our increased store base, of $6.0 million; and (3) non-cash stock
based compensation expense of $1.7 million. These increases were partially offset by decreased severance costs of $1.7 million and self-
insurance costs of $3.2 million.
Advertising and promotion. Advertising and promotion expenses increased $6.0 million, or 13.4%, to $50.7 million for the year ended
December 31, 2006 compared to $44.7 million during the same period in 2005. Advertising expense increased as a result of an increase in
television advertising of $7.6 million, offset by decreases in other advertising related expenses of $1.6 million.
Other SG&A. Other SG&A expenses, including amortization expense, increased $16.2 million, or 21.3%, to $92.4 million for the year
ended December 31, 2006 compared to $76.2 million for the same period in 2005. This increase was due to increases in: (1) professional
expenses of $8.6 million, a portion of which related to a discretionary payment made to our non-employee stock option holders for $3.1 million;
(2) commission expense on our internet sales through www.gnc.com of $4.7 million; (3) accrual for legal settlement of $3.5 million; (4) credit
card discount fees of $1.5 million; and (5) intangible assets amortization of $0.6 million, in addition to a decrease in interest income on
franchisee notes receivable of $0.8 million. These were partially offset by decreases in other SG&A expenses of $0.7 million and bad debt
expense of $2.8 million, as a result of the decrease in accounts receivable, which was a direct result of the franchise acquisitions since the prior
year.
Foreign Currency Gain
We recognized a consolidated foreign currency gain of $0.7 million in the year ended December 31, 2006 compared to a gain of
$0.6 million for the year ended December 31, 2005. These gains resulted primarily from accounts payable activity with our Canadian subsidiary.
Other Expense / Income
Other expense for the year ended December 31, 2006 was $1.2 million, as a result of the loss on the sale of our Australian subsidiary,
which was completed in the fourth quarter of 2006. Other income for the year ended December 31, 2005 was $2.5 million, which was the
recognition of transaction fee income related to the transfer of our Australian franchise rights.
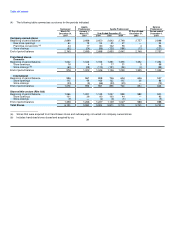
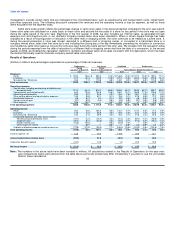
Operating Income
As a result of the foregoing, consolidated operating income increased $26.6 million, or 36.6%, to $99.2 million for the year ended
December 31, 2006 compared to $72.6 million for the same period in 2005. Operating income, as a percentage of net revenue, was 6.7% for
the year ended December 31, 2006 compared to 5.5% for the year ended December 31, 2005.
Retail. Operating income increased $50.2 million, or 65.0%, to $127.4 million for the year ended December 31, 2006 compared to
$77.2 million for the same period in 2005. The primary reason for the increase was increased sales and margin in all major product categories.
Franchise. Operating income increased $12.1 million, or 23.3%, to $64.1 million for the year ended December 31, 2006 compared to
$52.0 million for the same period in 2005. This increase is primarily attributable to an increase in wholesale sales to our international and
domestic franchisees, to support the increased retail sales domestically and internationally as well as the increased store growth internationally.
Manufacturing/Wholesale. Operating income increased $5.0 million, or 10.9%, to $51.0 million for the year ended December 31, 2006
compared to $46.0 million for the same period in 2005. This increase was primarily the result of higher third-party contract sales volume and
increased efficiencies in production, enabling higher margins.
Warehousing and Distribution Costs. Unallocated warehousing and distribution costs increased $0.7 million, or 1.4%, to $50.7 million for
the year ended December 31, 2006 compared to $50.0 million for the 49