GNC 2008 Annual Report Download - page 108
Download and view the complete annual report
Please find page 108 of the 2008 GNC annual report below. You can navigate through the pages in the report by either clicking on the pages listed below, or by using the keyword search tool below to find specific information within the annual report.-
 1
1 -
2
-
3
-
4
-
5
-
6
-
7
-
8
-
9
-
10
-
11
-
12
-
13
-
14
-
15
-
16
-
17
-
18
-
19
-
20
-
21
-
22
-
23
-
24
-
25
-
26
-
27
-
28
-
29
-
30
-
31
-
32
-
33
-
34
-
35
-
36
-
37
-
38
-
39
-
40
-
41
-
42
-
43
-
44
-
45
-
46
-
47
-
48
-
49
-
50
-
51
-
52
-
53
-
54
-
55
-
56
-
57
-
58
-
59
-
60
-
61
-
62
-
63
-
64
-
65
-
66
-
67
-
68
-
69
-
70
-
71
-
72
-
73
-
74
-
75
-
76
-
77
-
78
-
79
-
80
-
81
-
82
-
83
-
84
-
85
-
86
-
87
-
88
-
89
-
90
-
91
-
92
-
93
-
94
-
95
-
96
-
97
-
 98
98 -
 99
99 -
 100
100 -
 101
101 -
 102
102 -
 103
103 -
 104
104 -
 105
105 -
 106
106 -
 107
107 -
 108
108 -
 109
109 -
 110
110 -
 111
111 -
 112
112 -
 113
113 -
 114
114 -
 115
115 -
 116
116 -
 117
117 -
 118
118 -
119
-
120
-
121
-
122
-
123
-
124
-
125
-
126
-
127
-
128
-
129
-
130
-
131
-
132
-
133
-
134
-
135
-
136
-
137
-
138
-
139
-
140
-
141
-
142
-
143
-
144
-
145
-
146
-
147
-
148
-
149
-
150
-
151
-
152
-
153
-
154
-
155
-
156
-
157
-
158
-
159
-
160
-
161
-
162
-
163
-
164
-
165
-
166
-
167
-
168
-
169
-
170
-
171
-
172
-
173
-
174
-
175
-
176
-
177
-
178
-
179
-
180
-
181
-
182
-
183
-
184
-
185
-
186
-
187
-
188
-
189
-
190
-
191
-
192
-
193
-
194
-
195
-
196
-
197
-
198
-
199
-
200
-
201
-
202
-
203
-
204
-
205
-
206
-
207
-
208
-
209
-
210
-
211
-
212
-
213
-
214
-
215
-
216
-
217
-
218
-
219
-
220
-
221
-
222
-
223
-
224
-
225
-
226
-
227
-
228
-
229
-
230
-
231
-
232
-
233
-
234
-
235
-
236
-
237
-
238
-
239
-
240
-
241
-
242
-
243
-
244
-
245
-
246
-
247
-
248
-
249
-
250
-
251
-
252
-
253
-
254
-
255
-
256
-
257
-
258
-
259
-
260
-
261
-
262
-
263
-
264
-
265
-
266
-
267
-
268
-
269
-
270
-
271
-
272
-
273
-
274
-
275
-
276
-
277
-
278
-
279
-
280
-
281
-
282
 |
 |

Table of Contents
GENERAL NUTRITION CENTERS, INC. AND SUBSIDIARIES
NOTES TO CONSOLIDATED FINANCIAL STATEMENTS
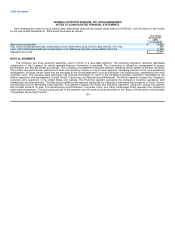
Had compensation costs for stock options been determined using the fair market value method of SFAS No. 123, the effect on net income
for the year ended December 31, 2005 would have been as follows:
Year ended
December 31,
2005
(in thousands)
Net income as reported $ 18,666
Add: total stock-based employee compensation costs determined using intrinsic value method, net of tax 399
Less: total stock-based employee compensation costs determine using fair value method, net of tax (1,294)
Adjusted net income $ 17,771
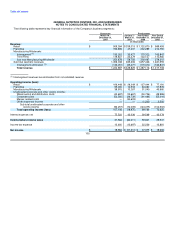
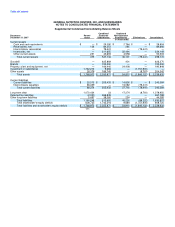
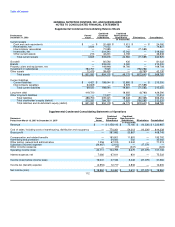
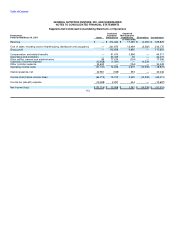
NOTE 20. SEGMENTS
The Company has three operating segments, each of which is a reportable segment. The operating segments represent identifiable
components of the Company for which separate financial information is available. This information is utilized by management to assess
performance and allocate assets accordingly. The Company's management evaluates segment operating results based on several indicators.
The primary key performance indicators are sales and operating income or loss for each segment. Operating income or loss, as evaluated by
management, excludes certain items that are managed at the consolidated level, such as distribution and warehousing, impairments and other
corporate costs. The following table represents key financial information for each of the Company's business segments, identifiable by the
distinct operations and management of each: Retail, Franchising, and Manufacturing/Wholesale. The Retail segment includes the Company's
corporate store operations in the United States and Canada. The Franchise segment represents the Company's franchise operations, both
domestically and internationally. The Manufacturing/Wholesale segment represents the Company's manufacturing operations in South Carolina
and Australia and the Wholesale sales business. This segment supplies the Retail and Franchise segments, along with various third parties,
with finished products for sale. The Warehousing and Distribution, Corporate Costs, and Other Unallocated Costs represent the Company's
administrative expenses. The accounting policies of the segments are the same as those described in the "Basis of Presentation and Summary
of Significant Accounting Policies". 104