GNC 2008 Annual Report Download - page 116
Download and view the complete annual report
Please find page 116 of the 2008 GNC annual report below. You can navigate through the pages in the report by either clicking on the pages listed below, or by using the keyword search tool below to find specific information within the annual report.-
 1
1 -
2
-
3
-
4
-
5
-
6
-
7
-
8
-
9
-
10
-
11
-
12
-
13
-
14
-
15
-
16
-
17
-
18
-
19
-
20
-
21
-
22
-
23
-
24
-
25
-
26
-
27
-
28
-
29
-
30
-
31
-
32
-
33
-
34
-
35
-
36
-
37
-
38
-
39
-
40
-
41
-
42
-
43
-
44
-
45
-
46
-
47
-
48
-
49
-
50
-
51
-
52
-
53
-
54
-
55
-
56
-
57
-
58
-
59
-
60
-
61
-
62
-
63
-
64
-
65
-
66
-
67
-
68
-
69
-
70
-
71
-
72
-
73
-
74
-
75
-
76
-
77
-
78
-
79
-
80
-
81
-
82
-
83
-
84
-
85
-
86
-
87
-
88
-
89
-
90
-
91
-
92
-
93
-
94
-
95
-
96
-
97
-
98
-
99
-
100
-
101
-
102
-
103
-
104
-
105
-
 106
106 -
 107
107 -
 108
108 -
 109
109 -
 110
110 -
 111
111 -
 112
112 -
 113
113 -
 114
114 -
 115
115 -
 116
116 -
 117
117 -
 118
118 -
 119
119 -
 120
120 -
 121
121 -
 122
122 -
 123
123 -
 124
124 -
 125
125 -
 126
126 -
127
-
128
-
129
-
130
-
131
-
132
-
133
-
134
-
135
-
136
-
137
-
138
-
139
-
140
-
141
-
142
-
143
-
144
-
145
-
146
-
147
-
148
-
149
-
150
-
151
-
152
-
153
-
154
-
155
-
156
-
157
-
158
-
159
-
160
-
161
-
162
-
163
-
164
-
165
-
166
-
167
-
168
-
169
-
170
-
171
-
172
-
173
-
174
-
175
-
176
-
177
-
178
-
179
-
180
-
181
-
182
-
183
-
184
-
185
-
186
-
187
-
188
-
189
-
190
-
191
-
192
-
193
-
194
-
195
-
196
-
197
-
198
-
199
-
200
-
201
-
202
-
203
-
204
-
205
-
206
-
207
-
208
-
209
-
210
-
211
-
212
-
213
-
214
-
215
-
216
-
217
-
218
-
219
-
220
-
221
-
222
-
223
-
224
-
225
-
226
-
227
-
228
-
229
-
230
-
231
-
232
-
233
-
234
-
235
-
236
-
237
-
238
-
239
-
240
-
241
-
242
-
243
-
244
-
245
-
246
-
247
-
248
-
249
-
250
-
251
-
252
-
253
-
254
-
255
-
256
-
257
-
258
-
259
-
260
-
261
-
262
-
263
-
264
-
265
-
266
-
267
-
268
-
269
-
270
-
271
-
272
-
273
-
274
-
275
-
276
-
277
-
278
-
279
-
280
-
281
-
282
 |
 |

Table of Contents
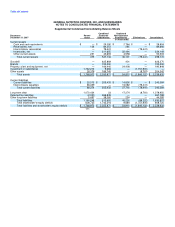
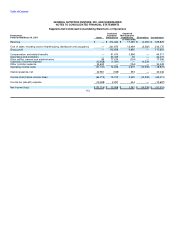
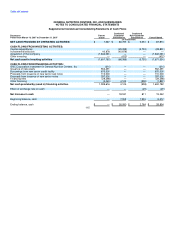
GENERAL NUTRITION CENTERS, INC. AND SUBSIDIARIES
NOTES TO CONSOLIDATED FINANCIAL STATEMENTS
Supplemental Condensed Consolidating Balance Sheets
Combined Combined
Predecessor Parent/ Guarantor Non-Guarantor
December 31, 2006 Issuer Subsidiaries Subsidiaries Eliminations Consolidated
(in thousands)
Current assets
Cash and cash equivalents $ — $ 20,469 $ 3,611 $ — $ 24,080
Receivables, net 3,636 71,053 138 — 74,827
Intercompany receivables — 71,585 — (71,585) —
Inventories, net — 304,340 15,042 — 319,382
Other current assets 213 42,231 4,192 — 46,636
Total current assets 3,849 509,678 22,983 (71,585) 464,925
Goodwill — 80,592 430 — 81,022
Brands — 209,000 3,000 — 212,000
Property, plant and equipment, net — 148,948 19,760 — 168,708
Investment in subsidiaries 784,757 7,525 — (792,282) —
Other assets 12,475 38,435 — (8,780) 42,130
Total assets $ 801,081 $ 994,178 $ 46,173 $ (872,647) $ 968,785
Current liabilities
Current liabilities $ 4,421 $ 198,044 $ 12,885 $ — $ 215,350
Intercompany payables 64,609 — 6,976 (71,585) —
Total current liabilities 69,030 198,044 19,861 (71,585) 215,350
Long-term debt 419,720 — 18,650 (8,780) 429,590
Other long-term liabilities — 11,377 137 — 11,514
Total liabilities 488,750 209,421 38,648 (80,365) 656,454
Total stockholder's equity (deficit) 312,331 784,757 7,525 (792,282) 312,331
Total liabilities and stockholder's equity (deficit) $ 801,081 $ 994,178 $ 46,173 $ (872,647) $ 968,785
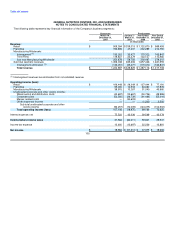
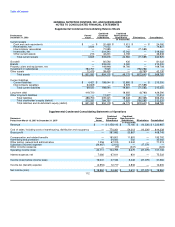
Supplemental Condensed Consolidating Statements of Operations
Combined Combined
Successor Parent/ Guarantor Non-Guarantor
Period from March 16, 2007 to December 31, 2007 Issuer Subsidiaries Subsidiaries Eliminations Consolidated
(in thousands)
Revenue $ — $ 1,158,143 $ 75,180 $ (10,336) $ 1,222,987
Cost of sales, including costs of warehousing, distribution and occupancy — 770,261 54,313 (10,336) 814,238
Gross profit — 387,882 20,867 — 408,749
Compensation and related benefits — 183,901 11,891 — 195,792
Advertising and promotion — 34,560 502 — 35,062
Other selling, general and administrative 1,356 67,315 2,542 — 71,213
Subsidiary (income) expense (24,467) (2,612) — 27,079 —
Other (income) expense — (77) (347) — (424)
Operating income (loss) 23,111 104,795 6,279 (27,079) 107,106
Interest expense, net 7,080 67,611 831 — 75,522
Income (loss) before income taxes 16,031 37,184 5,448 (27,079) 31,584
Income tax (benefit) expense (2,953) 12,717 2,836 — 12,600
Net income (loss) $ 18,984 $ 24,467 $ 2,612 $ (27,079) $ 18,984
112