GNC 2008 Annual Report Download - page 85
Download and view the complete annual report
Please find page 85 of the 2008 GNC annual report below. You can navigate through the pages in the report by either clicking on the pages listed below, or by using the keyword search tool below to find specific information within the annual report.-
 1
1 -
2
-
3
-
4
-
5
-
6
-
7
-
8
-
9
-
10
-
11
-
12
-
13
-
14
-
15
-
16
-
17
-
18
-
19
-
20
-
21
-
22
-
23
-
24
-
25
-
26
-
27
-
28
-
29
-
30
-
31
-
32
-
33
-
34
-
35
-
36
-
37
-
38
-
39
-
40
-
41
-
42
-
43
-
44
-
45
-
46
-
47
-
48
-
49
-
50
-
51
-
52
-
53
-
54
-
55
-
56
-
57
-
58
-
59
-
60
-
61
-
62
-
63
-
64
-
65
-
66
-
67
-
68
-
69
-
70
-
71
-
72
-
73
-
74
-
 75
75 -
 76
76 -
 77
77 -
 78
78 -
 79
79 -
 80
80 -
 81
81 -
 82
82 -
 83
83 -
 84
84 -
 85
85 -
 86
86 -
 87
87 -
 88
88 -
 89
89 -
 90
90 -
 91
91 -
 92
92 -
 93
93 -
 94
94 -
 95
95 -
96
-
97
-
98
-
99
-
100
-
101
-
102
-
103
-
104
-
105
-
106
-
107
-
108
-
109
-
110
-
111
-
112
-
113
-
114
-
115
-
116
-
117
-
118
-
119
-
120
-
121
-
122
-
123
-
124
-
125
-
126
-
127
-
128
-
129
-
130
-
131
-
132
-
133
-
134
-
135
-
136
-
137
-
138
-
139
-
140
-
141
-
142
-
143
-
144
-
145
-
146
-
147
-
148
-
149
-
150
-
151
-
152
-
153
-
154
-
155
-
156
-
157
-
158
-
159
-
160
-
161
-
162
-
163
-
164
-
165
-
166
-
167
-
168
-
169
-
170
-
171
-
172
-
173
-
174
-
175
-
176
-
177
-
178
-
179
-
180
-
181
-
182
-
183
-
184
-
185
-
186
-
187
-
188
-
189
-
190
-
191
-
192
-
193
-
194
-
195
-
196
-
197
-
198
-
199
-
200
-
201
-
202
-
203
-
204
-
205
-
206
-
207
-
208
-
209
-
210
-
211
-
212
-
213
-
214
-
215
-
216
-
217
-
218
-
219
-
220
-
221
-
222
-
223
-
224
-
225
-
226
-
227
-
228
-
229
-
230
-
231
-
232
-
233
-
234
-
235
-
236
-
237
-
238
-
239
-
240
-
241
-
242
-
243
-
244
-
245
-
246
-
247
-
248
-
249
-
250
-
251
-
252
-
253
-
254
-
255
-
256
-
257
-
258
-
259
-
260
-
261
-
262
-
263
-
264
-
265
-
266
-
267
-
268
-
269
-
270
-
271
-
272
-
273
-
274
-
275
-
276
-
277
-
278
-
279
-
280
-
281
-
282
 |
 |
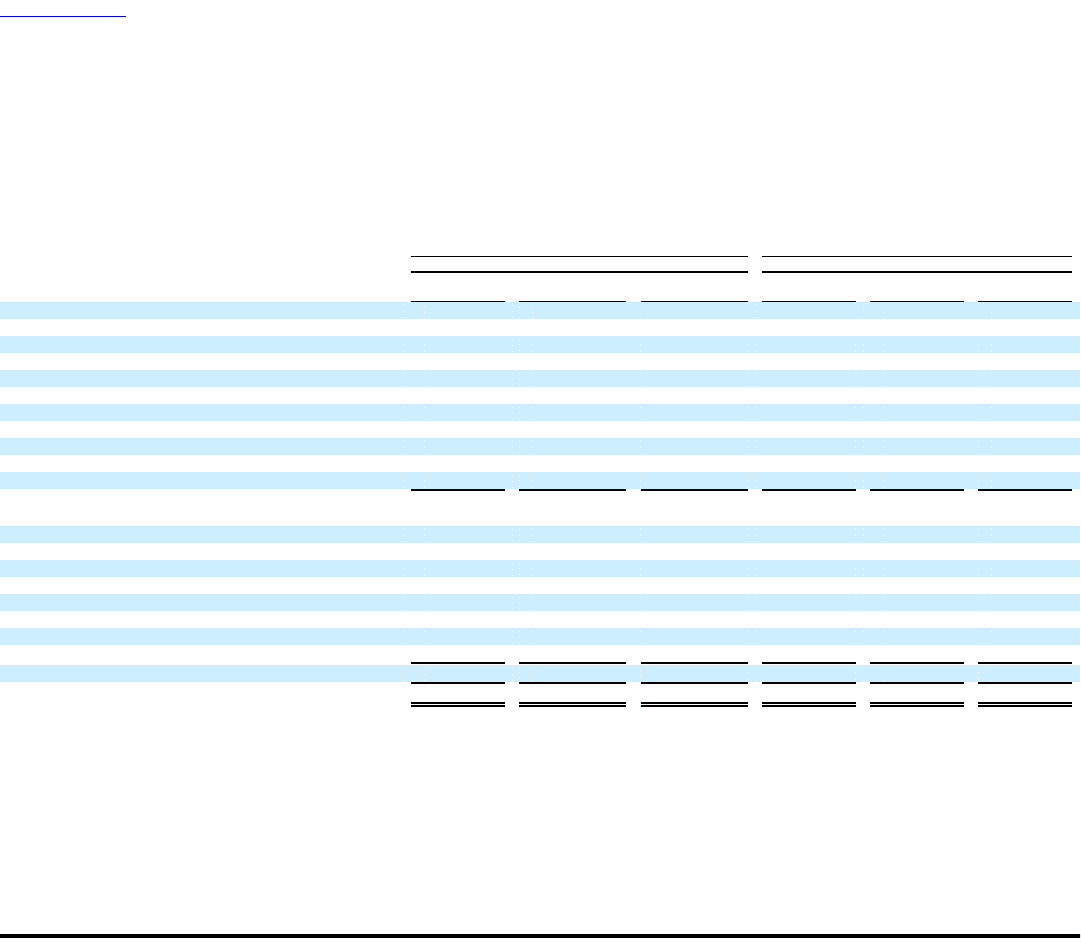
Table of Contents
GENERAL NUTRITION CENTERS, INC. AND SUBSIDIARIES
NOTES TO CONSOLIDATED FINANCIAL STATEMENTS
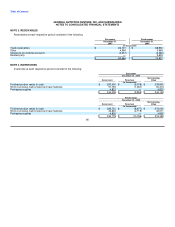
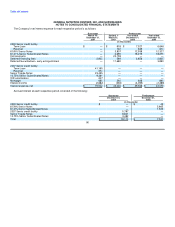
NOTE 5. INCOME TAXES
Deferred income taxes reflect the net tax effects of temporary differences between the carrying amount of assets and liabilities for financial
reporting purposes and the amounts used for income tax purposes.
Significant components of the Company's deferred tax assets and liabilities at each respective period consisted of the following:
Successor Predecessor
December 31, 2007 December 31, 2006
(in thousands)
Assets Liabilities Net Assets Liabilities Net
Deferred tax:
Current assets (liabilities):
Operating reserves $ 2,779 $ — $ 2,779 $ 3,956 $ — $ 3,956
Inventory capitalization — (394) (394) 4,191 — 4,191
Deferred revenue 12,084 — 12,084 11,804 — 11,804
Prepaid expenses — (8,520) (8,520) — (8,289) (8,289)
Accrued worker compensation 1,680 — 1,680 2,774 — 2,774
Settlements 3,290 — 3,290 — — —
Stock compensation — — — 1,061 — 1,061
Foreign tax credits 4,675 — 4,675 — — —
Other 1,435 — 1,435 1,811 (570) 1,241
Total current $ 25,943 $ (8,914) $ 17,029 $ 25,597 $ (8,859) $ 16,738
Non-current assets (liabilities):
Intangibles $ — $ (303,319) $ (303,319) $ — $ (14,282) $ (14,282)
Fixed assets 12,771 — 12,771 14,709 — 14,709
Stock compensation 694 — 694 — — —
Net operating loss carryforwards 23,726 — 23,726 13,227 — 13,227
Interest rate swap 2,051 — 2,051 — — —
Other 7,244 — 7,244 3,407 (3,159) 248
Valuation allowance (10,955) — (10,955) (13,227) — (13,227)
Total non-current $ 35,531 $ (303,319) $ (267,788) $ 18,116 $ (17,441) $ 675
Total net deferred taxes $ 61,474 $ (312,233) $ (250,759) $ 43,713 $ (26,300) $ 17,413
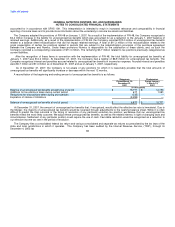
As of December 31, 2007 the Company had deferred tax assets relating to federal tax net operating losses (NOLs) in the amount of
$10.8 million. As of December 31, 2007 and 2006, the Company had deferred tax assets relating to state NOLs in the amount of $12.9 million
and $13.2 million, respectively. With the exception of $2.0 million of deferred tax assets as of December 31, 2007, a valuation allowance has
been provided for all the state NOLs as the Company believes that these NOLs, with lives ranging from five to twenty years, will not be
realizable prior to their expiration.
Deferred income taxes were not provided on cumulative undistributed earnings of international subsidiaries, at December 31, 2007 and
2006, as unremitted earnings of the Company's non-U.S. subsidiaries were determined to be permanently reinvested.
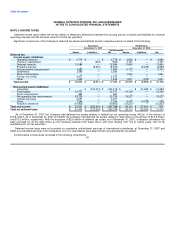
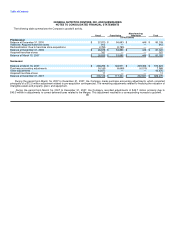
Income before income taxes consisted of the following components:
81