GNC 2008 Annual Report Download - page 110
Download and view the complete annual report
Please find page 110 of the 2008 GNC annual report below. You can navigate through the pages in the report by either clicking on the pages listed below, or by using the keyword search tool below to find specific information within the annual report.-
 1
1 -
2
-
3
-
4
-
5
-
6
-
7
-
8
-
9
-
10
-
11
-
12
-
13
-
14
-
15
-
16
-
17
-
18
-
19
-
20
-
21
-
22
-
23
-
24
-
25
-
26
-
27
-
28
-
29
-
30
-
31
-
32
-
33
-
34
-
35
-
36
-
37
-
38
-
39
-
40
-
41
-
42
-
43
-
44
-
45
-
46
-
47
-
48
-
49
-
50
-
51
-
52
-
53
-
54
-
55
-
56
-
57
-
58
-
59
-
60
-
61
-
62
-
63
-
64
-
65
-
66
-
67
-
68
-
69
-
70
-
71
-
72
-
73
-
74
-
75
-
76
-
77
-
78
-
79
-
80
-
81
-
82
-
83
-
84
-
85
-
86
-
87
-
88
-
89
-
90
-
91
-
92
-
93
-
94
-
95
-
96
-
97
-
98
-
99
-
 100
100 -
 101
101 -
 102
102 -
 103
103 -
 104
104 -
 105
105 -
 106
106 -
 107
107 -
 108
108 -
 109
109 -
 110
110 -
 111
111 -
 112
112 -
 113
113 -
 114
114 -
 115
115 -
 116
116 -
 117
117 -
 118
118 -
 119
119 -
 120
120 -
121
-
122
-
123
-
124
-
125
-
126
-
127
-
128
-
129
-
130
-
131
-
132
-
133
-
134
-
135
-
136
-
137
-
138
-
139
-
140
-
141
-
142
-
143
-
144
-
145
-
146
-
147
-
148
-
149
-
150
-
151
-
152
-
153
-
154
-
155
-
156
-
157
-
158
-
159
-
160
-
161
-
162
-
163
-
164
-
165
-
166
-
167
-
168
-
169
-
170
-
171
-
172
-
173
-
174
-
175
-
176
-
177
-
178
-
179
-
180
-
181
-
182
-
183
-
184
-
185
-
186
-
187
-
188
-
189
-
190
-
191
-
192
-
193
-
194
-
195
-
196
-
197
-
198
-
199
-
200
-
201
-
202
-
203
-
204
-
205
-
206
-
207
-
208
-
209
-
210
-
211
-
212
-
213
-
214
-
215
-
216
-
217
-
218
-
219
-
220
-
221
-
222
-
223
-
224
-
225
-
226
-
227
-
228
-
229
-
230
-
231
-
232
-
233
-
234
-
235
-
236
-
237
-
238
-
239
-
240
-
241
-
242
-
243
-
244
-
245
-
246
-
247
-
248
-
249
-
250
-
251
-
252
-
253
-
254
-
255
-
256
-
257
-
258
-
259
-
260
-
261
-
262
-
263
-
264
-
265
-
266
-
267
-
268
-
269
-
270
-
271
-
272
-
273
-
274
-
275
-
276
-
277
-
278
-
279
-
280
-
281
-
282
 |
 |

Table of Contents
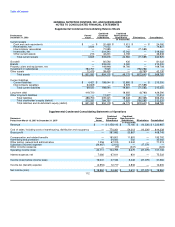
GENERAL NUTRITION CENTERS, INC. AND SUBSIDIARIES
NOTES TO CONSOLIDATED FINANCIAL STATEMENTS
Successor Predecessor
March 16 - January 1 - Year Ended Year Ended
December 31, March 15, December 31, December 31,
2007 2007 2006 2005
(in thousands)
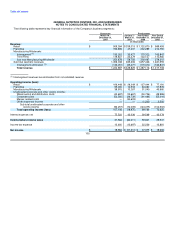
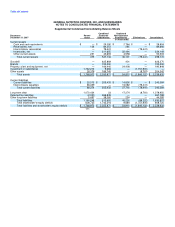
Depreciation and amortization:
Retail $ 14,806 $ 4,114 $ 22,143 $ 24,313
Franchise 4,025 365 1,837 1,889
Manufacturing / Wholesale 7,014 1,714 8,364 8,414
Corporate / Other 4,144 1,182 6,834 6,420
Total depreciation and amortization $ 29,989 $ 7,375 $ 39,178 $ 41,036
Capital expenditures:
Retail $ 18,347 $ 4,778 $ 15,440 $ 11,657
Franchise 4 — — —
Manufacturing / Wholesale 6,694 285 5,933 6,033
Corporate / Other 3,806 630 2,473 3,135
Total capital expenditures $ 28,851 $ 5,693 $ 23,846 $ 20,825
Total assets
Retail $ 1,242,999 $ 472,131 $ 485,153 $ 441,364
Franchise 476,685 273,348 275,530 290,092
Manufacturing / Wholesale 426,250 129,438 133,899 148,445
Corporate / Other 93,698 106,348 74,203 145,739
Total assets $ 2,239,632 $ 981,265 $ 968,785 $ 1,025,640
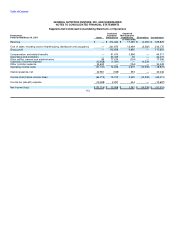
Geographic areas
Total revenues:
United States $ 1,156,806 $ 314,804 $ 1,413,650 $ 1,255,468
Foreign 66,181 15,025 73,466 62,240
Total revenues $ 1,222,987 $ 329,829 $ 1,487,116 $ 1,317,708
Long-lived assets:
United States $ 189,416 $ 181,617 $ 171,609 $ 185,541
Foreign 6,526 3,323 3,223 4,055
Total long-lived assets $ 195,942 $ 184,940 $ 174,832 $ 189,596
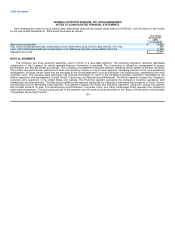
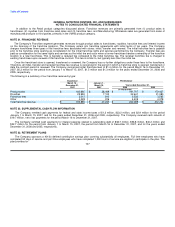
The following table represents sales by general product category. The category "Other" includes other wellness products sales from the
Company's point of sales system and certain required accounting adjustments of ($0.6) million for the period from January 1 to March 15, 2007,
$5.0 million for the period from March 16 to December 31, 2007, $0.1 million for 2006, $3.0 million for 2005, and sales from www.gnc.com of
$6.7 million for the period from January 1 to March 15, 2007, $21.6 million for the period from March 16 to December 31, 2007, and
$17.1 million for 2006.
Successor Predecessor
Period Period
March 16- January 1-
December March 15, Year ended December 31,
2007 2007 2006 2005
(in thousands)
U.S Retail Product Categories:
VMHS $ 335,521 $ 96,190 $ 415,344 $ 377,699
Sports Nutrition Products 291,069 85,566 369,731 330,308
Diet and Weight Management Products 116,772 35,652 158,693 135,219
Other Wellness Products 99,721 26,880 111,140 90,800
Total U.S. Retail revenues 843,083 244,288 1,054,908 934,026
Canada retail revenues (1) 66,181 15,025 67,762 55,467
Total Retail Revenue $ 909,264 $ 259,313 $ 1,122,670 $ 989,493
(1) Product sales for Canda are managed in local currency, therefore the total results are reflected in this table.
106