GNC 2008 Annual Report Download - page 48
Download and view the complete annual report
Please find page 48 of the 2008 GNC annual report below. You can navigate through the pages in the report by either clicking on the pages listed below, or by using the keyword search tool below to find specific information within the annual report.-
 1
1 -
2
-
3
-
4
-
5
-
6
-
7
-
8
-
9
-
10
-
11
-
12
-
13
-
14
-
15
-
16
-
17
-
18
-
19
-
20
-
21
-
22
-
23
-
24
-
25
-
26
-
27
-
28
-
29
-
30
-
31
-
32
-
33
-
34
-
35
-
36
-
37
-
 38
38 -
 39
39 -
 40
40 -
 41
41 -
 42
42 -
 43
43 -
 44
44 -
 45
45 -
 46
46 -
 47
47 -
 48
48 -
 49
49 -
 50
50 -
 51
51 -
 52
52 -
 53
53 -
 54
54 -
 55
55 -
 56
56 -
 57
57 -
 58
58 -
59
-
60
-
61
-
62
-
63
-
64
-
65
-
66
-
67
-
68
-
69
-
70
-
71
-
72
-
73
-
74
-
75
-
76
-
77
-
78
-
79
-
80
-
81
-
82
-
83
-
84
-
85
-
86
-
87
-
88
-
89
-
90
-
91
-
92
-
93
-
94
-
95
-
96
-
97
-
98
-
99
-
100
-
101
-
102
-
103
-
104
-
105
-
106
-
107
-
108
-
109
-
110
-
111
-
112
-
113
-
114
-
115
-
116
-
117
-
118
-
119
-
120
-
121
-
122
-
123
-
124
-
125
-
126
-
127
-
128
-
129
-
130
-
131
-
132
-
133
-
134
-
135
-
136
-
137
-
138
-
139
-
140
-
141
-
142
-
143
-
144
-
145
-
146
-
147
-
148
-
149
-
150
-
151
-
152
-
153
-
154
-
155
-
156
-
157
-
158
-
159
-
160
-
161
-
162
-
163
-
164
-
165
-
166
-
167
-
168
-
169
-
170
-
171
-
172
-
173
-
174
-
175
-
176
-
177
-
178
-
179
-
180
-
181
-
182
-
183
-
184
-
185
-
186
-
187
-
188
-
189
-
190
-
191
-
192
-
193
-
194
-
195
-
196
-
197
-
198
-
199
-
200
-
201
-
202
-
203
-
204
-
205
-
206
-
207
-
208
-
209
-
210
-
211
-
212
-
213
-
214
-
215
-
216
-
217
-
218
-
219
-
220
-
221
-
222
-
223
-
224
-
225
-
226
-
227
-
228
-
229
-
230
-
231
-
232
-
233
-
234
-
235
-
236
-
237
-
238
-
239
-
240
-
241
-
242
-
243
-
244
-
245
-
246
-
247
-
248
-
249
-
250
-
251
-
252
-
253
-
254
-
255
-
256
-
257
-
258
-
259
-
260
-
261
-
262
-
263
-
264
-
265
-
266
-
267
-
268
-
269
-
270
-
271
-
272
-
273
-
274
-
275
-
276
-
277
-
278
-
279
-
280
-
281
-
282
 |
 |

Table of Contents
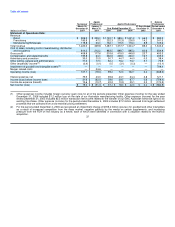
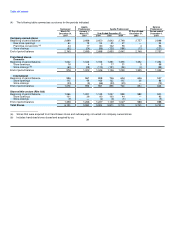
Comparison of the Years Ended December 31, 2007 and 2006
Revenues
Our consolidated net revenues increased $65.7 million, or 4.4%, to $1,552.8 million for the year ended December 31, 2007 compared to
$1,487.1 million for the same period in 2006. The increase was the result of increased same store sales in our Retail segment, increased
product sales in our Franchise segment, and increased revenue in our Manufacturing/Wholesale segment.
Retail. Revenues in our Retail segment increased $45.9 million, or 4.1%, to $1,168.6 million for the year ended December 31, 2007
compared to $1,122.7 million for the same period in 2006. Included as part of the revenue increase was $28.3 million in revenue for sales
through www.gnc.com compared to $17.1 million in 2006. In 2007, our domestic company-owned same store sales improved by 1.4% and our
Canadian company-owned stores improved by 8.5% for the same period. Our company-owned store base increased by 44 stores to 2,598
domestically, and our Canadian store base increased by 13 stores to 147 at December 31, 2007.
Franchise. Revenues in our Franchise segment increased $8.8 million, or 3.8%, to $241.1 million for the year ended December 31, 2007
compared to $232.3 million for the same period in 2006. This increase is due to increases in our international franchise revenue of $11.3 million
as a result of higher product sales and royalties, offset by a $2.4 million decrease in domestic franchise revenue, the result of operating 68
fewer domestic franchise stores in the year ended December 31, 2007 compared to the same period in 2006. There were 978 domestic
franchise stores at December 31, 2007 compared to 1,046 at December 31, 2006. Our international franchise store base increased by 117
stores to 1,078 at December 31, 2007 compared to 961 at December 31, 2006.
Manufacturing/Wholesale. Revenues in our Manufacturing/Wholesale segment, which includes third-party sales from our manufacturing
facility in South Carolina, as well as wholesale sales to Rite Aid and drugstore.com, increased $11.0 million, or 8.3%, to $143.1 million for the
year ended December 31, 2007 compared to $132.1 million for the same period in 2006. Wholesale sales to Rite Aid and drugstore.com
increased by $12.3 million, primarily a result of 131 net store-within-a-store openings in 2007. Sales in the South Carolina plant increased by
$4.3 million, as available capacity in the plant was utilized for third party contracts. Additionally, we had $5.7 million in sales in the year ended
December 31, 2006 from our Australia facility, which was sold in November 2006.
Cost of Sales
Consolidated cost of sales, which includes product costs, costs of warehousing, distribution and occupancy costs, increased
$42.9 million, or 4.4%, to $1,026.4 million for the year ended December 31, 2007 compared to $983.5 million for the same period in 2006.
Consolidated cost of sales, as a percentage of net revenue, was 66.1% for each of the years ended December 31, 2007 and 2006.
Product costs. Product costs increased $35.4 million, or 4.8%, to $768.2 million for the year ended December 31, 2007 compared to
$732.8 million for the same period in 2006. This increase is primarily due to increased sales volumes at the retail stores partially offset by
increased vendor support. Consolidated product costs, as a percentage of net revenue, were 49.5% for the year ended December 31, 2007
compared to 49.3% for the year ended December 31, 2006. Included in product costs was $15.5 million of non-cash expense from amortization
of inventory step up to fair value due to the Merger. 44