GNC 2008 Annual Report Download - page 65
Download and view the complete annual report
Please find page 65 of the 2008 GNC annual report below. You can navigate through the pages in the report by either clicking on the pages listed below, or by using the keyword search tool below to find specific information within the annual report.-
 1
1 -
2
-
3
-
4
-
5
-
6
-
7
-
8
-
9
-
10
-
11
-
12
-
13
-
14
-
15
-
16
-
17
-
18
-
19
-
20
-
21
-
22
-
23
-
24
-
25
-
26
-
27
-
28
-
29
-
30
-
31
-
32
-
33
-
34
-
35
-
36
-
37
-
38
-
39
-
40
-
41
-
42
-
43
-
44
-
45
-
46
-
47
-
48
-
49
-
50
-
51
-
52
-
53
-
54
-
 55
55 -
 56
56 -
 57
57 -
 58
58 -
 59
59 -
 60
60 -
 61
61 -
 62
62 -
 63
63 -
 64
64 -
 65
65 -
 66
66 -
 67
67 -
 68
68 -
 69
69 -
 70
70 -
 71
71 -
 72
72 -
 73
73 -
 74
74 -
 75
75 -
76
-
77
-
78
-
79
-
80
-
81
-
82
-
83
-
84
-
85
-
86
-
87
-
88
-
89
-
90
-
91
-
92
-
93
-
94
-
95
-
96
-
97
-
98
-
99
-
100
-
101
-
102
-
103
-
104
-
105
-
106
-
107
-
108
-
109
-
110
-
111
-
112
-
113
-
114
-
115
-
116
-
117
-
118
-
119
-
120
-
121
-
122
-
123
-
124
-
125
-
126
-
127
-
128
-
129
-
130
-
131
-
132
-
133
-
134
-
135
-
136
-
137
-
138
-
139
-
140
-
141
-
142
-
143
-
144
-
145
-
146
-
147
-
148
-
149
-
150
-
151
-
152
-
153
-
154
-
155
-
156
-
157
-
158
-
159
-
160
-
161
-
162
-
163
-
164
-
165
-
166
-
167
-
168
-
169
-
170
-
171
-
172
-
173
-
174
-
175
-
176
-
177
-
178
-
179
-
180
-
181
-
182
-
183
-
184
-
185
-
186
-
187
-
188
-
189
-
190
-
191
-
192
-
193
-
194
-
195
-
196
-
197
-
198
-
199
-
200
-
201
-
202
-
203
-
204
-
205
-
206
-
207
-
208
-
209
-
210
-
211
-
212
-
213
-
214
-
215
-
216
-
217
-
218
-
219
-
220
-
221
-
222
-
223
-
224
-
225
-
226
-
227
-
228
-
229
-
230
-
231
-
232
-
233
-
234
-
235
-
236
-
237
-
238
-
239
-
240
-
241
-
242
-
243
-
244
-
245
-
246
-
247
-
248
-
249
-
250
-
251
-
252
-
253
-
254
-
255
-
256
-
257
-
258
-
259
-
260
-
261
-
262
-
263
-
264
-
265
-
266
-
267
-
268
-
269
-
270
-
271
-
272
-
273
-
274
-
275
-
276
-
277
-
278
-
279
-
280
-
281
-
282
 |
 |

Table of Contents
component of equity. This new consolidation method significantly changes the accounting for transactions with minority interest holders.
SFAS 160 is effective for fiscal years beginning after December 15, 2008 with early application prohibited. We will adopt SFAS 160 beginning in
the first quarter of fiscal 2009 and is currently evaluating the impact of adopting SFAS 160 on its consolidated financial statements.
In May 2007, the FASB issued FASB Staff Position No. FIN 48-1, Definition of Settlement in FASB Interpretation No. 48 ("the FSP"). The
FSP provides guidance about how an enterprise should determine whether a tax position is effectively settled for the purpose of recognizing
previously unrecognized tax benefits. Under the FSP, a tax position could be effectively settled on completion of examination by a taxing
authority if the entity does not intend to appeal or litigate the result and it is remote that the taxing authority would examine or re-examine the
tax position. We applied the provisions of the FSP during 2007.
ITEM 7A. QUANTITATIVE AND QUALITATIVE DISCLOSURES ABOUT MARKET RISK.
Market risk represents the risk of changes in the value of market risk sensitive instruments caused by fluctuations in interest rates, foreign
exchange rates and commodity prices. Changes in these factors could cause fluctuations in the results of our operations and cash flows. In the
ordinary course of business, we are primarily exposed to foreign currency and interest rate risks. We do not use derivative financial instruments
in connection with these commodity market risks.
We are exposed to market risks from interest rate changes on our variable debt. Although changes in interest rates do not impact our
operating income the changes could affect the fair value of such financial instruments and interest payments. As of December 31, 2007, we had
fixed rate debt of $119.8 million and variable rate debt of $967.2 million. In conjunction with the Merger, we entered into an interest rate swap,
effective April 2, 2007, which effectively converts a portion of the variable LIBOR component of the effective interest rate on two $150.0 million
notional portions of our debt under our $675.0 million senior credit facility to a fixed rate over a specified term. Each of these $150.0 million
notional amounts has a three month LIBOR tranche conforming to the interest payment dates on the term loan.
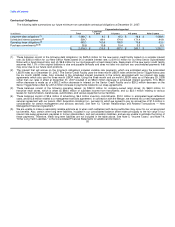
These agreements are summarized in the following table:
Derivative Total Notional Amount Term Company Pays Counterparty Pays
Interest Rate Swap $150.0 million April 2007 - April 2010 LIBOR + 225 basis points 4.8965%
Interest Rate Swap $150.0 million April 2007 - April 2009 LIBOR + 225 basis points 4.9430%
Based on our variable rate debt balance as of December 31, 2007, a 1% change in interest rates would increase or decrease our annual
interest cost by $6.7 million.
Foreign Exchange Rate Risk
We are subject to the risk of foreign currency exchange rate changes in the conversion from local currencies to the U.S. dollar of the
reported financial position and operating results of our non-U.S. based subsidiaries. We are also subject to foreign currency exchange rate
changes for purchases of goods and services that are denominated in currencies other than the U.S. dollar. The primary currency to which we
are exposed to fluctuations is the Canadian Dollar. The fair value of our net foreign investments and our foreign denominated payables would
not be materially affected by a 10% adverse change in foreign currency exchange rates for the periods presented.
61