GNC 2008 Annual Report Download - page 49
Download and view the complete annual report
Please find page 49 of the 2008 GNC annual report below. You can navigate through the pages in the report by either clicking on the pages listed below, or by using the keyword search tool below to find specific information within the annual report.-
 1
1 -
2
-
3
-
4
-
5
-
6
-
7
-
8
-
9
-
10
-
11
-
12
-
13
-
14
-
15
-
16
-
17
-
18
-
19
-
20
-
21
-
22
-
23
-
24
-
25
-
26
-
27
-
28
-
29
-
30
-
31
-
32
-
33
-
34
-
35
-
36
-
37
-
38
-
 39
39 -
 40
40 -
 41
41 -
 42
42 -
 43
43 -
 44
44 -
 45
45 -
 46
46 -
 47
47 -
 48
48 -
 49
49 -
 50
50 -
 51
51 -
 52
52 -
 53
53 -
 54
54 -
 55
55 -
 56
56 -
 57
57 -
 58
58 -
 59
59 -
60
-
61
-
62
-
63
-
64
-
65
-
66
-
67
-
68
-
69
-
70
-
71
-
72
-
73
-
74
-
75
-
76
-
77
-
78
-
79
-
80
-
81
-
82
-
83
-
84
-
85
-
86
-
87
-
88
-
89
-
90
-
91
-
92
-
93
-
94
-
95
-
96
-
97
-
98
-
99
-
100
-
101
-
102
-
103
-
104
-
105
-
106
-
107
-
108
-
109
-
110
-
111
-
112
-
113
-
114
-
115
-
116
-
117
-
118
-
119
-
120
-
121
-
122
-
123
-
124
-
125
-
126
-
127
-
128
-
129
-
130
-
131
-
132
-
133
-
134
-
135
-
136
-
137
-
138
-
139
-
140
-
141
-
142
-
143
-
144
-
145
-
146
-
147
-
148
-
149
-
150
-
151
-
152
-
153
-
154
-
155
-
156
-
157
-
158
-
159
-
160
-
161
-
162
-
163
-
164
-
165
-
166
-
167
-
168
-
169
-
170
-
171
-
172
-
173
-
174
-
175
-
176
-
177
-
178
-
179
-
180
-
181
-
182
-
183
-
184
-
185
-
186
-
187
-
188
-
189
-
190
-
191
-
192
-
193
-
194
-
195
-
196
-
197
-
198
-
199
-
200
-
201
-
202
-
203
-
204
-
205
-
206
-
207
-
208
-
209
-
210
-
211
-
212
-
213
-
214
-
215
-
216
-
217
-
218
-
219
-
220
-
221
-
222
-
223
-
224
-
225
-
226
-
227
-
228
-
229
-
230
-
231
-
232
-
233
-
234
-
235
-
236
-
237
-
238
-
239
-
240
-
241
-
242
-
243
-
244
-
245
-
246
-
247
-
248
-
249
-
250
-
251
-
252
-
253
-
254
-
255
-
256
-
257
-
258
-
259
-
260
-
261
-
262
-
263
-
264
-
265
-
266
-
267
-
268
-
269
-
270
-
271
-
272
-
273
-
274
-
275
-
276
-
277
-
278
-
279
-
280
-
281
-
282
 |
 |

Table of Contents
Warehousing and distribution costs. Warehousing and distribution costs increased $1.7 million, or 3.1%, to $54.2 million for the year
ended December 31, 2007 compared to $52.5 million for the same period in 2006. This increase was attributable to higher third party shipping
and fuel costs and increased supply costs. Consolidated warehousing and distribution costs, as a percentage of net revenue, were 3.5% for
each of the years ended December 31, 2007 and 2006.
Occupancy costs. Occupancy costs increased $5.8 million, or 2.9%, to $204.0 million for the year ended December 31, 2007 compared
to $198.2 million for the same period in 2006. This increase was the result of higher lease-related costs of $9.1 million, which was the result of
normal increases in lease related costs and the addition of 44 corporate stores since December 31, 2006, and increased utility costs of
$0.5 million, which were partially offset by a reduction in depreciation expense of $3.8 million. Consolidated occupancy costs, as a percentage
of net revenue, were 13.1% for the year ended December 31, 2007 compared to 13.3% for the year ended December 31, 2006. Included in
occupancy costs was $0.1 million of income related to lease adjustments to fair value as a result of the Merger.
Selling, General and Administrative ("SG&A") Expenses
Our consolidated SG&A expenses, including compensation and related benefits, advertising and promotion expense, other selling,
general and administrative expenses, and amortization expense, increased $0.3 million, or 0.1%, to $404.2 million, for the year ended
December 31, 2007 compared to $403.9 million for the same period in 2006. These expenses, as a percentage of net revenue, were 26.1% for
the year ended December 31, 2007 compared to 27.1% for the year ended December 31, 2006.
Compensation and related benefits. Compensation and related benefits decreased $0.7 million, or 0.3%, to $260.1 million for the year
ended December 31, 2007 compared to $260.8 million for the same period in 2006. Decreases occurred in incentive accruals and payments of
$8.9 million and, in 2006, we paid $19.1 million in discretionary payments to our employee option holders. These decreases were offset by
Merger-related costs and normal operating increases. Increases occurred in the following areas due to merger-related costs: (1) $3.8 million of
non-cash stock based compensation generated as a result of the cancellation of all stock options at the merger date; (2) $9.6 million in
accelerated discretionary payments made to vested option holders and includes the associated payroll taxes; and (3) $1.9 million in incentives
related to the sale of the Company. Additionally, operating increases occurred in the following areas: (1) $5.8 million of increased wages in our
stores to support the higher sales and the 44 new locations added since December 31, 2006; (2) $3.6 million in increased health care costs; (3)
$2.2 million in workers compensation expense; and (4) other compensation and related benefits accounts of $0.4 million.
Advertising and promotion. Advertising and promotion expenses increased $4.8 million, or 9.4%, to $55.5 million for the year ended
December 31, 2007 compared to $50.7 million during the same period in 2006. Advertising expense increased as a result of an increase in print
and television advertising of $2.4 million, an increase in website advertising of $0.8 million, a reduction in contributions from our domestic
franchisees to our national ad fund of $0.8 million, and increase in other advertising related expenses of $0.8 million.
Other SG&A. Other SG&A expenses, including amortization expense, decreased $3.8 million, or 4.1%, to $88.6 million for the year
ended December 31, 2007 compared to $92.4 million for the same period in 2006. This decrease was due to reductions in: (1) professional
expenses of $5.2 million; (2) legal settlement expenses of $4.3 million; and (3) depreciation expense of $1.1 million. These were partially offset
by increases in (1) amortization expense of $5.4 million; (2) third-party commission selling expense of $1.9 million; (3) credit card fees of
$0.9 million; and (4) other SG&A expenses of $1.7 million. Additionally, in 2006, we paid $3.1 million in discretionary payments to our non-
employee option holders.
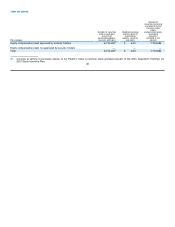
Foreign Currency Gain
We recognized a consolidated foreign currency gain of $0.6 million in the year ended December 31, 2007 compared to a gain of
$0.7 million for the year ended December 31, 2006. These gains resulted primarily from accounts payable activity with our Canadian subsidiary.
45