GNC 2008 Annual Report Download - page 46
Download and view the complete annual report
Please find page 46 of the 2008 GNC annual report below. You can navigate through the pages in the report by either clicking on the pages listed below, or by using the keyword search tool below to find specific information within the annual report.-
 1
1 -
2
-
3
-
4
-
5
-
6
-
7
-
8
-
9
-
10
-
11
-
12
-
13
-
14
-
15
-
16
-
17
-
18
-
19
-
20
-
21
-
22
-
23
-
24
-
25
-
26
-
27
-
28
-
29
-
30
-
31
-
32
-
33
-
34
-
35
-
 36
36 -
 37
37 -
 38
38 -
 39
39 -
 40
40 -
 41
41 -
 42
42 -
 43
43 -
 44
44 -
 45
45 -
 46
46 -
 47
47 -
 48
48 -
 49
49 -
 50
50 -
 51
51 -
 52
52 -
 53
53 -
 54
54 -
 55
55 -
 56
56 -
57
-
58
-
59
-
60
-
61
-
62
-
63
-
64
-
65
-
66
-
67
-
68
-
69
-
70
-
71
-
72
-
73
-
74
-
75
-
76
-
77
-
78
-
79
-
80
-
81
-
82
-
83
-
84
-
85
-
86
-
87
-
88
-
89
-
90
-
91
-
92
-
93
-
94
-
95
-
96
-
97
-
98
-
99
-
100
-
101
-
102
-
103
-
104
-
105
-
106
-
107
-
108
-
109
-
110
-
111
-
112
-
113
-
114
-
115
-
116
-
117
-
118
-
119
-
120
-
121
-
122
-
123
-
124
-
125
-
126
-
127
-
128
-
129
-
130
-
131
-
132
-
133
-
134
-
135
-
136
-
137
-
138
-
139
-
140
-
141
-
142
-
143
-
144
-
145
-
146
-
147
-
148
-
149
-
150
-
151
-
152
-
153
-
154
-
155
-
156
-
157
-
158
-
159
-
160
-
161
-
162
-
163
-
164
-
165
-
166
-
167
-
168
-
169
-
170
-
171
-
172
-
173
-
174
-
175
-
176
-
177
-
178
-
179
-
180
-
181
-
182
-
183
-
184
-
185
-
186
-
187
-
188
-
189
-
190
-
191
-
192
-
193
-
194
-
195
-
196
-
197
-
198
-
199
-
200
-
201
-
202
-
203
-
204
-
205
-
206
-
207
-
208
-
209
-
210
-
211
-
212
-
213
-
214
-
215
-
216
-
217
-
218
-
219
-
220
-
221
-
222
-
223
-
224
-
225
-
226
-
227
-
228
-
229
-
230
-
231
-
232
-
233
-
234
-
235
-
236
-
237
-
238
-
239
-
240
-
241
-
242
-
243
-
244
-
245
-
246
-
247
-
248
-
249
-
250
-
251
-
252
-
253
-
254
-
255
-
256
-
257
-
258
-
259
-
260
-
261
-
262
-
263
-
264
-
265
-
266
-
267
-
268
-
269
-
270
-
271
-
272
-
273
-
274
-
275
-
276
-
277
-
278
-
279
-
280
-
281
-
282
 |
 |

Table of Contents
• revitalized vendor relationships, including their new product development activities and our exclusive or first-to-market access to new
products;
• realigned our franchise system with our corporate strategies and re-acquired or closed unprofitable or non-compliant franchised stores
in order to improve the financial performance of the franchise system;
• reduced our overhead cost structure; and
• launched internet sales of our products on www.gnc.com.
These and other strategies led to a reversal of the negative trends of the business. Domestic same store sales improved in each quarter
of the year, culminating with a 3.3% increase in company-owned same store sales in the third quarter of 2007. For the year ended
December 31, 2007 and 2006, domestic same store sales increased 1.4% and 11.1% respectively.
Additionally, in July 2007, we extended our alliance with Rite Aid through December 31, 2014, with Rite Aid's commitment to open 1,125
new store-within-a-store locations by that date.
The following discussion and analysis of our historical financial condition and results of operations covers periods prior to and including
the consummation of the Merger. Accordingly, the discussion and analysis of these periods does not reflect the complete and significant impact
the Merger and related transactions has had on us. As a result of the Merger and related transactions, we are highly leveraged. Significant
additional liquidity requirements, resulting primarily from increased interest expense and other factors, such as increased depreciation and
amortization as a result of the application of purchase accounting, will significantly affect our financial condition, results of operations, and
liquidity going forward.
Related Parties
For the period March 16, 2007 to December 31, 2007, we have related party transactions with Ares Management and Ontario Teachers
Pension Plan and affiliates. For the period January 1, 2007 to March 15, 2007 and the years ended December 31, 2006, and 2005, we had
related party transactions with Apollo Management V and its affiliates. For further discussion of these transactions, see Item 13, "Certain
Relationships and Related Transactions" and the "Related Party Transactions" note to our consolidated financial statements included in this
Form 10-K.
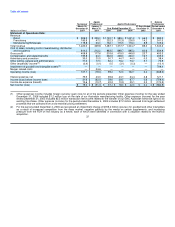
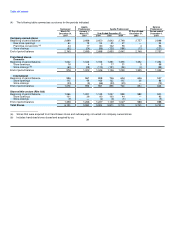
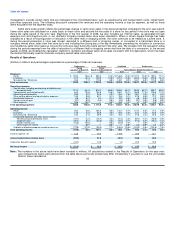
Results of Operations
The following information presented as of December 31, 2007, 2006, and 2005 and for the period January 1 to March 15, 2007, the
period March 16, 2007 to December 31, 2007, and the years ended December 31, 2006, and 2005 was derived from our audited consolidated
financial statements and accompanying notes. In the table below and in the accompanying discussion, the period January 1 to March 15, 2007
and March 16 to December 31, 2007 have been combined for discussion purposes as we believe this further enhances comparability to the
other years presented rather than a discussion of the separate periods. This approach is not consistent with generally accepted accounting
principles and yields results that are not comparable on a period-to-period basis due to the new basis of accounting established at the
Acquisition date. Material differences that were generated as a result of the Merger are explained in the appropriate sections.
The foregoing information may contain financial measures other than in accordance with generally accepted accounting principles, and
should not be considered in isolation from or as a substitute for our historical consolidated financial statements. In addition, the adjusted
combined operating results may not reflect the actual results we would have achieved absent the adjustments and may not be predictive of
future results of operations. We present this information because we use it to monitor and evaluate our ongoing operating results and trends,
and believe it provides investors with an understanding of our operating performance over comparative periods.
As discussed in the "Segment" note to our consolidated financial statements, we evaluate segment operating results based on several
indicators. The primary key performance indicators are revenues and operating income or loss for each segment. Revenues and operating
income or loss, as evaluated by 42