EasyJet 2014 Annual Report Download - page 85
Download and view the complete annual report
Please find page 85 of the 2014 EasyJet annual report below. You can navigate through the pages in the report by either clicking on the pages listed below, or by using the keyword search tool below to find specific information within the annual report.-
 1
1 -
2
-
3
-
4
-
5
-
6
-
7
-
8
-
9
-
10
-
11
-
12
-
13
-
14
-
15
-
16
-
17
-
18
-
19
-
20
-
21
-
22
-
23
-
24
-
25
-
26
-
27
-
28
-
29
-
30
-
31
-
32
-
33
-
34
-
35
-
36
-
37
-
38
-
39
-
40
-
41
-
42
-
43
-
44
-
45
-
46
-
47
-
48
-
49
-
50
-
51
-
52
-
53
-
54
-
55
-
56
-
57
-
58
-
59
-
60
-
61
-
62
-
63
-
64
-
65
-
66
-
67
-
68
-
69
-
70
-
71
-
72
-
73
-
74
-
 75
75 -
 76
76 -
 77
77 -
 78
78 -
 79
79 -
 80
80 -
 81
81 -
 82
82 -
 83
83 -
 84
84 -
 85
85 -
 86
86 -
 87
87 -
 88
88 -
 89
89 -
 90
90 -
 91
91 -
 92
92 -
 93
93 -
 94
94 -
 95
95 -
96
-
97
-
98
-
99
-
100
-
101
-
102
-
103
-
104
-
105
-
106
-
107
-
108
-
109
-
110
-
111
-
112
-
113
-
114
-
115
-
116
-
117
-
118
-
119
-
120
-
121
-
122
-
123
-
124
-
125
-
126
-
127
-
128
-
129
-
130
-
131
-
132
-
133
-
134
-
135
-
136
-
137
-
138
-
139
-
140
 |
 |

www.easyJet.com 83
Governance
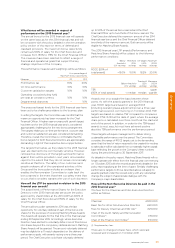
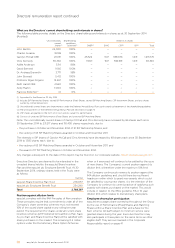
• customer satisfaction targets – 78% of customers
satisfied with the service;
• total cost per seat excluding fuel at constant currency –
0.6% increase; and
• Chief Financial Officer’s departmental objectives – these
were exceeded.
76% of the maximum bonus was awarded to the
Chief Executive and Chief Financial Officer in respect
of performance for the year ended 30 September 2014.
This resulted in a bonus payment of £1,033,790 to the
Chief Executive and £473,660 to the Chief Financial
Officer. One-third of the bonus is compulsorily deferred
into shares for three years and subject to continued
employment. In addition, Executive Directors can voluntarily
defer a portion of their bonus which may be eligible for
Matching Share Awards.
The Committee is satisfied with the overall payments in
light of the level of performance achieved.
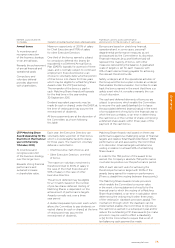
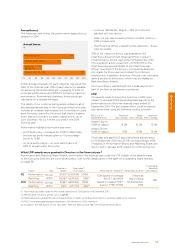
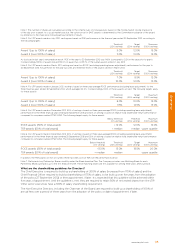
LTIP
The awards made to Executive Directors in 2012 were
subject to average ROCE (excluding lease adjustments)
performance over the three financial years ended 30
September 2014. The percentage which could be earned
was determined using the following vesting schedule:
ROCE y/e 30
September 2014
Threshold
(25% vesting)
Target
(50% vesting)
Maximum
(100% vesting)
Award 1 (up to
100% of salary) 8.0% 10.0% 12.0%
Award 2 (over
100% of salary) 11.5% 12.5% 13.0%
Three year average ROCE (excluding lease adjustments)
to 30 September 2014 was 22.0%; correspondingly 100%
of awards of Performance Shares and Matching Shares are
due to vest in January 2015, subject to continued service.
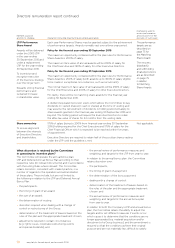
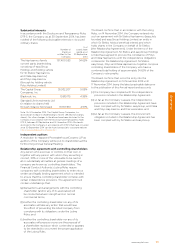
Annual bonus
The following chart shows the performance against bonus
targets for 2014:
Annual bonus
%
Profit before tax
Customer
satisfaction
On-time performance 61
82
30
0 10 20 30 40 50 60 70 80 90 100
Cost per seat (ex fuel) 100
A sliding scale of targets for each objective was set at the
start of the financial year. 10% of each element is payable
for achieving the threshold target, increasing to 50% for
on-target performance and 100% for achieving maximum
performance. Achievements between these points are
calculated on a straight-line basis.
The safety of our customers and people underpins all of
the operational activities of the Group and the bonus plan
includes an underpin that enables the Committee to scale
back the bonus earned in the event that there is a safety
event that occurs that it considers warrants the use of
such discretion. No such event occurred in the 2014
financial year.
Performance highlights during the year were:
• profit before tax – increased by 21.5% to £581 million
and pre-tax profit margins grew by 1.6 percentage
points to 12.8%;
• on-time performance – on-time performance of
85% of arrivals within 15 minutes;
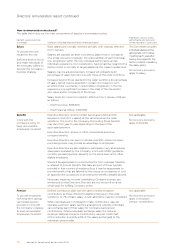
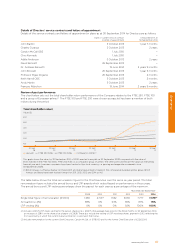
What LTIP awards were granted to Directors in the financial year?
Performance and Matching Share Awards were made in the financial year under the LTIP. Details of the awards made
to the Executive Directors are summarised below, with further details given in the table on outstanding share interests
on page 86.
Award Type
Number of
Shares
Face value(1)
(% of salary) Performance condition(2) Performance period
% vesting at
threshold
performance
CE Performance Nil cost
option
90,517 £1,363,186 200% 50% based on average
ROCE(4) and 50%
based on relative TSR(5)
(versus FTSE 51-150)
3 financial
years ending
30 September
2016
25%
Matching 38,283 £576,542 85%(3)
CFO Performance Nil cost
option
41,857 £630,366 150%
Matching 11,801 £177,723 42%(3)
(1) Face value calculated based on the closing share price of 1,506 pence on 16 December 2013.
(2) Performance conditions are set out on page 85.
(3) Matching awards are granted over an equal number of shares as the Executive Directors voluntarily defer bonus (pre-tax).
(4) ROCE (including operating lease adjustments) 15% threshold to 20% maximum.
(5) In addition, the TSR awards will not vest unless there has been positive TSR over the performance period.