EasyJet 2014 Annual Report Download - page 123
Download and view the complete annual report
Please find page 123 of the 2014 EasyJet annual report below. You can navigate through the pages in the report by either clicking on the pages listed below, or by using the keyword search tool below to find specific information within the annual report.-
 1
1 -
2
-
3
-
4
-
5
-
6
-
7
-
8
-
9
-
10
-
11
-
12
-
13
-
14
-
15
-
16
-
17
-
18
-
19
-
20
-
21
-
22
-
23
-
24
-
25
-
26
-
27
-
28
-
29
-
30
-
31
-
32
-
33
-
34
-
35
-
36
-
37
-
38
-
39
-
40
-
41
-
42
-
43
-
44
-
45
-
46
-
47
-
48
-
49
-
50
-
51
-
52
-
53
-
54
-
55
-
56
-
57
-
58
-
59
-
60
-
61
-
62
-
63
-
64
-
65
-
66
-
67
-
68
-
69
-
70
-
71
-
72
-
73
-
74
-
75
-
76
-
77
-
78
-
79
-
80
-
81
-
82
-
83
-
84
-
85
-
86
-
87
-
88
-
89
-
90
-
91
-
92
-
93
-
94
-
95
-
96
-
97
-
98
-
99
-
100
-
101
-
102
-
103
-
104
-
105
-
106
-
107
-
108
-
109
-
110
-
111
-
112
-
 113
113 -
 114
114 -
 115
115 -
 116
116 -
 117
117 -
 118
118 -
 119
119 -
 120
120 -
 121
121 -
 122
122 -
 123
123 -
 124
124 -
 125
125 -
 126
126 -
 127
127 -
 128
128 -
 129
129 -
 130
130 -
 131
131 -
 132
132 -
 133
133 -
134
-
135
-
136
-
137
-
138
-
139
-
140
 |
 |

Accounts & other information
www.easyJet.com 121
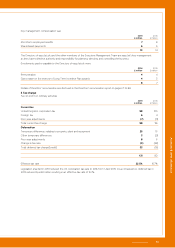
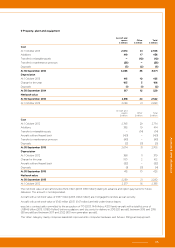
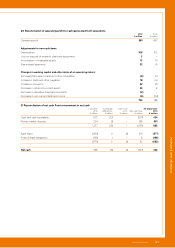
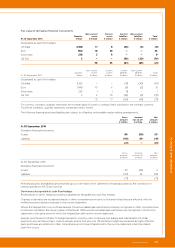
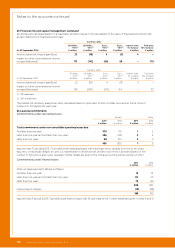
20 Reconciliation of operating profit to cash generated from operations
2014
£ million
2013
£ million
Operating profit 581 497
Adjustments for non-cash items:
Depreciation 106 102
Loss on disposal of property, plant and equipment 2 –
Amortisation of intangible assets 12 10
Share-based payments 23 18
Changes in working capital and other items of an operating nature:
(Increase)/decrease in trade and other receivables (6) 74
Increase in trade and other payables 18 64
Increase in provisions 32 29
Decrease in other non-current assets 33 8
Decrease in derivative financial instruments (2) –
Decrease in non-current deferred income (6) (14)
793 788
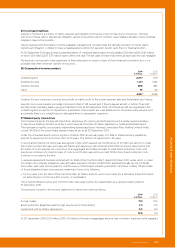
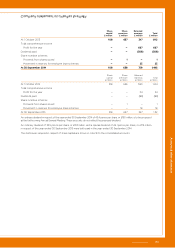
21 Reconciliation of net cash flow to movement in net cash
1 October
2013
£ million
Exchange
differences
£ million
Loan issue
costs
£ million
Net cash flow
£ million
30 September
2014
£ million
Cash and cash equivalents 1,013 (12) – (577) 424
Money market deposits 224 (1) – 338 561
1,237 (13) – (239) 985
Bank loans (484) 4 (1) 104 (377)
Finance lease obligations (195) 1 – 8 (186)
(679) 5 (1) 112 (563)
Net cash 558 (8) (1) (127) 422