EasyJet 2014 Annual Report Download - page 29
Download and view the complete annual report
Please find page 29 of the 2014 EasyJet annual report below. You can navigate through the pages in the report by either clicking on the pages listed below, or by using the keyword search tool below to find specific information within the annual report.-
 1
1 -
2
-
3
-
4
-
5
-
6
-
7
-
8
-
9
-
10
-
11
-
12
-
13
-
14
-
15
-
16
-
17
-
18
-
 19
19 -
 20
20 -
 21
21 -
 22
22 -
 23
23 -
 24
24 -
 25
25 -
 26
26 -
 27
27 -
 28
28 -
 29
29 -
 30
30 -
 31
31 -
 32
32 -
 33
33 -
 34
34 -
 35
35 -
 36
36 -
 37
37 -
 38
38 -
 39
39 -
40
-
41
-
42
-
43
-
44
-
45
-
46
-
47
-
48
-
49
-
50
-
51
-
52
-
53
-
54
-
55
-
56
-
57
-
58
-
59
-
60
-
61
-
62
-
63
-
64
-
65
-
66
-
67
-
68
-
69
-
70
-
71
-
72
-
73
-
74
-
75
-
76
-
77
-
78
-
79
-
80
-
81
-
82
-
83
-
84
-
85
-
86
-
87
-
88
-
89
-
90
-
91
-
92
-
93
-
94
-
95
-
96
-
97
-
98
-
99
-
100
-
101
-
102
-
103
-
104
-
105
-
106
-
107
-
108
-
109
-
110
-
111
-
112
-
113
-
114
-
115
-
116
-
117
-
118
-
119
-
120
-
121
-
122
-
123
-
124
-
125
-
126
-
127
-
128
-
129
-
130
-
131
-
132
-
133
-
134
-
135
-
136
-
137
-
138
-
139
-
140
 |
 |
www.easyJet.com 27
Strategic report
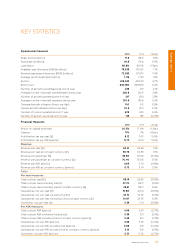
Key statistics
Operational measures
2014 2013 Change
Seats flown (millions) 71.5 68.0 5.1%
Passengers (millions) 64.8 60.8 6.6%
Load factor 90.6% 89.3% +1.3ppt
Available seat kilometres (ASK) (millions) 79,525 74,223 7.1%
Revenue passenger kilometres (RPK) (millions) 72,933 67,573 7.9%
Average sector length (kilometres) 1,112 1,091 1.9%
Sectors 439,943 420,311 4.7%
Block hours 849,790 799,480 6.3%
Number of aircraft owned/leased at end of year 226 217 4.1%
Average number of aircraft owned/leased during year 220.8 212.6 3.8%
Number of aircraft operated at end of year 217 209 3.8%
Average number of aircraft operated during year 210.8 199.8 5.5%
Operated aircraft utilisation (hours per day) 11.0 11.0 0.8%
Owned aircraft utilisation (hours per day) 10.6 10.3 2.4%
Number of routes operated at end of year 675 633 6.6%
Number of airports served at end of year 135 138 (2.2%)
Financial measures
2014 2013 Change
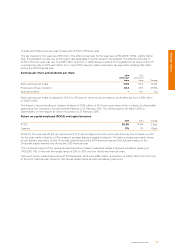
Return on capital employed 20.5% 17.4% +3.1ppt
Gearing 17% 7% +10ppt
Profit before tax per seat (£) 8.12 7.03 15.6%
Profit before tax per ASK (pence) 0.73 0.64 13.4%
Revenue
Revenue per seat (£) 63.31 62.58 1.2%
Revenue per seat at constant currency (£) 63.78 62.58 1.9%
Revenue per passenger (£) 69.90 70.08 (0.3%)
Revenue per passenger at constant currency (£) 70.40 70.08 0.5%
Revenue per ASK (pence) 5.69 5.74 (0.8%)
Revenue per ASK at constant currency (pence) 5.73 5.74 0.0%
Costs
Per seat measures
Total cost per seat (£) 55.19 55.55 (0.6%)
Total cost per seat excluding fuel (£) 37.70 38.17 (1.2%)
Total cost per seat excluding fuel at constant currency (£) 38.41 38.17 0.6%
Operational cost per seat (£) 51.80 52.14 (0.6%)
Operational cost per seat excluding fuel (£) 34.31 34.76 (1.3%)
Operational cost per seat excluding fuel at constant currency (£) 34.97 34.76 0.6%
Ownership cost per seat (£) 3.39 3.41 (0.8%)
Per ASK measures
Total cost per ASK (pence) 4.96 5.10 (2.7%)
Total cost per ASK excluding fuel (pence) 3.39 3.51 (3.1%)
Total cost per ASK excluding fuel at constant currency (pence) 3.45 3.51 (1.3%)
Operational cost per ASK (pence) 4.65 4.78 (2.5%)
Operational cost per ASK excluding fuel (pence) 3.08 3.19 (3.2%)
Operational cost per ASK excluding fuel at constant currency (pence) 3.14 3.19 (1.6%)
Ownership cost per ASK (pence) 0.31 0.32 (2.7%)