EasyJet 2014 Annual Report Download - page 25
Download and view the complete annual report
Please find page 25 of the 2014 EasyJet annual report below. You can navigate through the pages in the report by either clicking on the pages listed below, or by using the keyword search tool below to find specific information within the annual report.-
 1
1 -
2
-
3
-
4
-
5
-
6
-
7
-
8
-
9
-
10
-
11
-
12
-
13
-
14
-
 15
15 -
 16
16 -
 17
17 -
 18
18 -
 19
19 -
 20
20 -
 21
21 -
 22
22 -
 23
23 -
 24
24 -
 25
25 -
 26
26 -
 27
27 -
 28
28 -
 29
29 -
 30
30 -
 31
31 -
 32
32 -
 33
33 -
 34
34 -
 35
35 -
36
-
37
-
38
-
39
-
40
-
41
-
42
-
43
-
44
-
45
-
46
-
47
-
48
-
49
-
50
-
51
-
52
-
53
-
54
-
55
-
56
-
57
-
58
-
59
-
60
-
61
-
62
-
63
-
64
-
65
-
66
-
67
-
68
-
69
-
70
-
71
-
72
-
73
-
74
-
75
-
76
-
77
-
78
-
79
-
80
-
81
-
82
-
83
-
84
-
85
-
86
-
87
-
88
-
89
-
90
-
91
-
92
-
93
-
94
-
95
-
96
-
97
-
98
-
99
-
100
-
101
-
102
-
103
-
104
-
105
-
106
-
107
-
108
-
109
-
110
-
111
-
112
-
113
-
114
-
115
-
116
-
117
-
118
-
119
-
120
-
121
-
122
-
123
-
124
-
125
-
126
-
127
-
128
-
129
-
130
-
131
-
132
-
133
-
134
-
135
-
136
-
137
-
138
-
139
-
140
 |
 |

www.easyJet.com 23
Strategic report
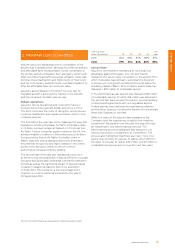
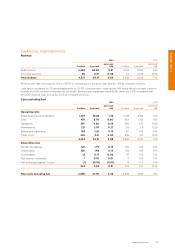
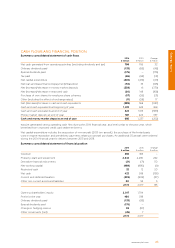
FINANCIAL PERFORMANCE
Revenue
2014 2013
£ million £ per seat
pence per
ASK £ million £ per seat
pence per
ASK
Seat revenue 4,462 62.40 5.61 4,194 61.64 5.65
Non-seat revenue 65 0.91 0.08 64 0.94 0.09
Total revenue 4,527 63.31 5.69 4,258 62.58 5.74
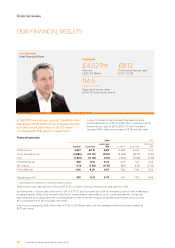
Revenue per seat improved by 1.2% to £63.31 in comparison to the prior year, and by 1.9% at constant currency.
Load factor increased by 1.3 percentage points to 90.6%, contributing to revenue per ASK being flat at constant currency
despite the 1.9% increase in average sector length. Revenue per passenger was £69.90, down by 0.3% compared with
the 2013 financial year, but up by 0.5% at constant currency.
Costs excluding fuel
2014 2013
£ million £ per seat
pence per
ASK £ million £ per seat
pence per
ASK
Operating costs
Airports and ground handling 1,107 15.48 1.39 1,078 15.84 1.45
Crew 479 6.70 0.60 454 6.68 0.61
Navigation 307 4.30 0.39 294 4.33 0.40
Maintenance 212 2.97 0.27 212 3.11 0.29
Selling and marketing 103 1.45 0.13 101 1.49 0.14
Other costs 245 3.41 0.30 226 3.31 0.30
2,453 34.31 3.08 2,365 34.76 3.19
Ownership costs
Aircraft dry leasing 124 1.73 0.16 102 1.49 0.14
Depreciation 106 1.49 0.13 102 1.50 0.15
Amortisation 12 0.17 0.02 10 0.15 0.01
Net interest receivable 7 0.10 0.01 11 0.16 0.01
Net exchange (gains) / losses (7) (0.10) (0.01) 8 0.11 0.01
242 3.39 0.31 233 3.41 0.32
Total costs excluding fuel 2,695 37.70 3.39 2,598 38.17 3.51