EasyJet 2014 Annual Report Download - page 24
Download and view the complete annual report
Please find page 24 of the 2014 EasyJet annual report below. You can navigate through the pages in the report by either clicking on the pages listed below, or by using the keyword search tool below to find specific information within the annual report.-
 1
1 -
2
-
3
-
4
-
5
-
6
-
7
-
8
-
9
-
10
-
11
-
12
-
13
-
 14
14 -
 15
15 -
 16
16 -
 17
17 -
 18
18 -
 19
19 -
 20
20 -
 21
21 -
 22
22 -
 23
23 -
 24
24 -
 25
25 -
 26
26 -
 27
27 -
 28
28 -
 29
29 -
 30
30 -
 31
31 -
 32
32 -
 33
33 -
 34
34 -
35
-
36
-
37
-
38
-
39
-
40
-
41
-
42
-
43
-
44
-
45
-
46
-
47
-
48
-
49
-
50
-
51
-
52
-
53
-
54
-
55
-
56
-
57
-
58
-
59
-
60
-
61
-
62
-
63
-
64
-
65
-
66
-
67
-
68
-
69
-
70
-
71
-
72
-
73
-
74
-
75
-
76
-
77
-
78
-
79
-
80
-
81
-
82
-
83
-
84
-
85
-
86
-
87
-
88
-
89
-
90
-
91
-
92
-
93
-
94
-
95
-
96
-
97
-
98
-
99
-
100
-
101
-
102
-
103
-
104
-
105
-
106
-
107
-
108
-
109
-
110
-
111
-
112
-
113
-
114
-
115
-
116
-
117
-
118
-
119
-
120
-
121
-
122
-
123
-
124
-
125
-
126
-
127
-
128
-
129
-
130
-
131
-
132
-
133
-
134
-
135
-
136
-
137
-
138
-
139
-
140
 |
 |

22 easyJet plc Annual report and accounts 2014
Financial review continued
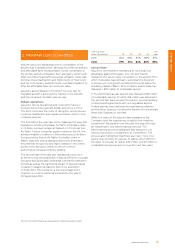
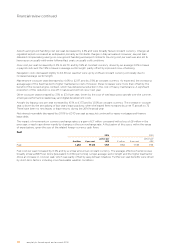
EXCHANGE RATES
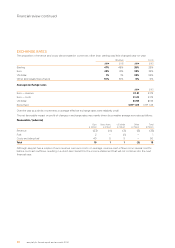
The proportion of revenue and costs denominated in currencies other than sterling was little changed year-on-year.
Revenue Costs
2014 2013 2014 2013
Sterling 47% 48% 26% 25%
Euro 42% 41% 33% 35%
US dollar 1% 1% 35% 34%
Other (principally Swiss franc) 10% 10% 6% 6%
Average exchange rates
2014 2013
Euro – revenue €1.21 €1.19
Euro – costs €1.22 €1.19
US dollar $1.59 $1.59
Swiss franc CHF 1.49 CHF 1.45
Over the year as a whole, movements in average effective exchange rates were relatively small.
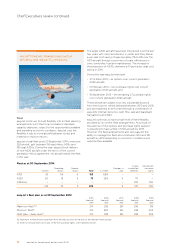
The net favourable impact on profit of changes in exchange rates was mainly driven by a weaker average euro rate as follows:
Favourable / (adverse)
Euro
£ million
Swiss franc
£ million
US dollar
£ million
Other
£ million
Total
£ million
Revenue (23) (4) (3) (3) (33)
Fuel 2 – (1) – 1
Costs excluding fuel 40 5 5 – 50
Total 19 1 1 (3) 18
Although easyJet has a surplus of euro revenue over euro costs, on average, revenue cash inflows occur several months
before cost cash outflows, resulting in a short-term benefit to the income statement that will not continue into the next
financial year.