EasyJet 2014 Annual Report Download - page 124
Download and view the complete annual report
Please find page 124 of the 2014 EasyJet annual report below. You can navigate through the pages in the report by either clicking on the pages listed below, or by using the keyword search tool below to find specific information within the annual report.-
 1
1 -
2
-
3
-
4
-
5
-
6
-
7
-
8
-
9
-
10
-
11
-
12
-
13
-
14
-
15
-
16
-
17
-
18
-
19
-
20
-
21
-
22
-
23
-
24
-
25
-
26
-
27
-
28
-
29
-
30
-
31
-
32
-
33
-
34
-
35
-
36
-
37
-
38
-
39
-
40
-
41
-
42
-
43
-
44
-
45
-
46
-
47
-
48
-
49
-
50
-
51
-
52
-
53
-
54
-
55
-
56
-
57
-
58
-
59
-
60
-
61
-
62
-
63
-
64
-
65
-
66
-
67
-
68
-
69
-
70
-
71
-
72
-
73
-
74
-
75
-
76
-
77
-
78
-
79
-
80
-
81
-
82
-
83
-
84
-
85
-
86
-
87
-
88
-
89
-
90
-
91
-
92
-
93
-
94
-
95
-
96
-
97
-
98
-
99
-
100
-
101
-
102
-
103
-
104
-
105
-
106
-
107
-
108
-
109
-
110
-
111
-
112
-
113
-
 114
114 -
 115
115 -
 116
116 -
 117
117 -
 118
118 -
 119
119 -
 120
120 -
 121
121 -
 122
122 -
 123
123 -
 124
124 -
 125
125 -
 126
126 -
 127
127 -
 128
128 -
 129
129 -
 130
130 -
 131
131 -
 132
132 -
 133
133 -
 134
134 -
135
-
136
-
137
-
138
-
139
-
140
 |
 |

122 easyJet plc Annual report and accounts 2014
Notes to the accounts continued
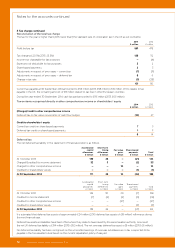
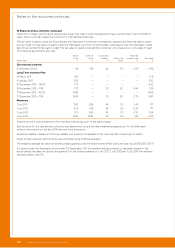
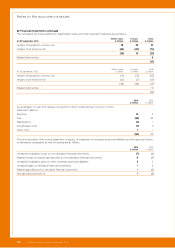
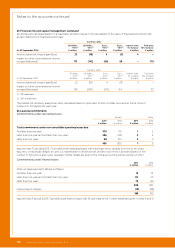
22 Financial instruments
Carrying value and fair value of financial assets and liabilities
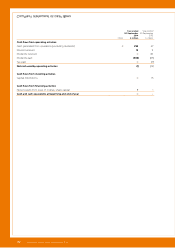
The fair values of financial assets and liabilities, together with the carrying value at each reporting date, are as follows:
Amortised cost
Held at fair
value
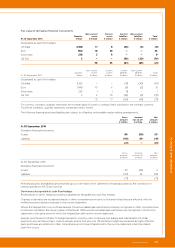
At 30 September 2014
Loans and
receivables
£ million
Financial
liabilities
£ million
Cash flow
hedges
£ million
Other
£ million
Carrying value
£ million
Fair value
£ million
Loan notes 4 – – – 4 4
Other non-current assets 95 – – 57 152 152
Trade and other receivables 141 – – 59 200 200
Trade and other payables – (434) – (676) (1,110) (1,110)
Derivative financial instruments – – (21) – (21) (21)
Restricted cash 32 – – – 32 32
Money market deposits 561 – – – 561 561
Cash and cash equivalents 424 – – – 424 424
Borrowings – (563) – – (563) (568)
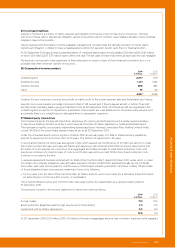
Amortised cost
Held at fair
value
At 30 September 2013
Loans and
receivables
£ million
Financial
liabilities
£ million
Cash flow
hedges
£ million
Other
£ million
Carrying value
£ million
Fair value
£ million
Loan notes 7 – – – 7 7
Other non-current assets 108 – – 77 185 185
Trade and other receivables 149 – – 45 194 194
Trade and other payables – (454) – (639) (1,093) (1,093)
Derivative financial instruments – – (71) – (71) (71)
Restricted cash 12 – – – 12 12
Money market deposits 224 – – – 224 224
Cash and cash equivalents 1,013 – – – 1,013 1,013
Borrowings – (679) – – (679) (687)
All financial instruments are in level 2 of the IFRS 13 fair value hierarchy.
Amounts disclosed in the ‘Other’ column are items that do not meet the definition of a financial instrument. They are disclosed to
facilitate reconciliation of the carrying values of financial instruments to line items presented in the statement of financial position.
Fair value calculation methodology
Derivative financial instruments are forward contracts that are valued based on market rates and market-accepted models. Fair
value for financial instruments held at amortised cost has been estimated by discounting cash flows at prevailing interest rates
and by applying year end exchange rates.