EasyJet 2014 Annual Report Download - page 137
Download and view the complete annual report
Please find page 137 of the 2014 EasyJet annual report below. You can navigate through the pages in the report by either clicking on the pages listed below, or by using the keyword search tool below to find specific information within the annual report.-
 1
1 -
2
-
3
-
4
-
5
-
6
-
7
-
8
-
9
-
10
-
11
-
12
-
13
-
14
-
15
-
16
-
17
-
18
-
19
-
20
-
21
-
22
-
23
-
24
-
25
-
26
-
27
-
28
-
29
-
30
-
31
-
32
-
33
-
34
-
35
-
36
-
37
-
38
-
39
-
40
-
41
-
42
-
43
-
44
-
45
-
46
-
47
-
48
-
49
-
50
-
51
-
52
-
53
-
54
-
55
-
56
-
57
-
58
-
59
-
60
-
61
-
62
-
63
-
64
-
65
-
66
-
67
-
68
-
69
-
70
-
71
-
72
-
73
-
74
-
75
-
76
-
77
-
78
-
79
-
80
-
81
-
82
-
83
-
84
-
85
-
86
-
87
-
88
-
89
-
90
-
91
-
92
-
93
-
94
-
95
-
96
-
97
-
98
-
99
-
100
-
101
-
102
-
103
-
104
-
105
-
106
-
107
-
108
-
109
-
110
-
111
-
112
-
113
-
114
-
115
-
116
-
117
-
118
-
119
-
120
-
121
-
122
-
123
-
124
-
125
-
126
-
 127
127 -
 128
128 -
 129
129 -
 130
130 -
 131
131 -
 132
132 -
 133
133 -
 134
134 -
 135
135 -
 136
136 -
 137
137 -
 138
138 -
 139
139 -
 140
140
 |
 |

Accounts & other information
www.easyJet.com 135
2014
£ million
2013
£ million
2012
£ million
2011
£ million
2010
£ million
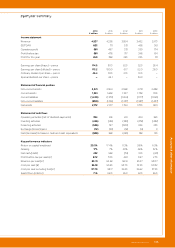
Income statement
Revenue 4,527
4,258 3,854 3,452 2,973
EBITDAR 823
711 531 468 361
Operating profit 581
497 331 269 174
Profit before tax 581
478 317 248 154
Profit for the year 450
398 255 225 121
Earnings per share (basic) – pence 114.5
101.3 62.5 52.5 28.4
Earnings per share (diluted) – pence 113.2
100.0 61.7 52.0 28.0
Ordinary dividend per share – pence 45.4 33.5 21.5 10.5 –
Special dividend per share – pence – 44.1 – 34.9 –
Statement of financial position
Non-current assets 3,221
2,964 2,968 2,731 2,488
Current assets 1,261
1,448 1,327 1,738 1,515
Current liabilities (1,420)
(1,379) (1,264) (1,177) (1,065)
Non-current liabilities (890)
(1,016) (1,237) (1,587) (1,437)
Net assets 2,172
2,017 1,794 1,705 1,501
Statement of cash flows
Operating activities (net of dividend payments) 394
616 261 424 363
Investing activities (445)
(416) (389) (478) (482)
Financing activities (526)
197 (309) 246 233
Exchange (losses)/gains (12)
(29) (18) (4) 9
Net (decrease)/increase in cash and cash equivalents (589)
368 (455) 188 123
Key performance indicators
Return on capital employed 20.5%
17.4% 11.3% 9.8% 6.9%
Gearing 17%
7% 29% 28% 32%
Net cash/(debt) 422
558 (74) 100 (40)
Profit before tax per seat (£) 8.12
7.03 4.81 3.97 2.75
Revenue per seat (£) 63.31
62.58 58.51 55.27 53.07
Cost per seat (£) 55.19
55.55 53.70 51.30 50.32
Cost per seat excluding fuel (£) 37.70
38.17 36.25 36.62 37.23
Seats flown (millions) 71.5
68.0 65.9 62.5 56.0